Maximum power, optimal load, and impedance analysis of piezoelectric vibration energy harvesters
Yabin Liao1,3 and Junrui Liang2 iD
1 Department of Mechanical Engineering Technology, Pennsylvania State University—Erie, Erie, PA 16563, United States of America
2 School of Information Science and Technology, ShanghaiTech University, Pudong, Shanghai 201210, People’s Republic of China
E-mail: Yabin.Liao@psu.edu
Received 4 April 2018, revised 29 May 2018
Accepted for publication 5 June 2018
Published 22 June 2018
Abstract
This paper performs an analysis of maximum power output of piezoelectric energy harvesters. It has been observed that there exists an overall power limit that can be obtained by tuning energy harvesting circuits, including both linear and nonlinear. The significance of the power limit is that it represents the maximum possible power output or capacity of an energy harvester. In other words, the harvested power is always capped by this limit regardless of the type and tuning of the energy harvesting circuit interface. The power limit and the optimal generalized electrical load or impedance to reach this power limit are first obtained directly by using the electromechanically coupled equations of the system, and then obtained by using the equivalent circuit analysis and impedance matching approach. Both are commonly used methods in energy harvesting research. This paper presents an effort to unify them but also offer insights on the power limit from two different perspectives. In the second part of this paper, the power limit and impedance matching results are applied to a linear energy harvesting circuit interface, i.e., resistive energy harvesting (REH) circuit, and a nonlinear circuit interface, i.e., standard AC–DC energy harvesting (SEH) circuit, to study their physical constraints on the impedance matching and clearly explain their power behaviors such as the maximum power and the effect of electromechanical coupling on the power. In addition, closed-form expressions, a relationship between the mechanical damping and the effective electromechanical coupling coefficient, to define the three types of coupling, i.e., weak, critical, strong, are obtained. It is found that the SEH harvesters require about 1.5 times of minimum electromechanical coupling of that of REH harvesters to reach the power limit, and the frequency bandwidth between the two power limit frequencies of a SEH harvester is narrower than that of a REH harvester given the same level of strong electromechanical coupling.
Keywords: energy harvesting, piezoelectric, power limit, optimal electrical load, impedance, equivalent circuit, maximum power
(Some figures may appear in colour only in the online journal)
1. Introduction
In the past few decades, research and development in renewable energy have exploded. Energy harvesting is the process of capturing the ambient surrounding energy and converting it into usable electrical energy. A number of renewable and harvestable energy sources exist, including waste heat, vibration, electromagnetic waves, wind, flowing water, and solar energy. The concept of power harvesting works toward developing selfpowered devices that do not require replaceable power supplies, for example, wireless sensors for structural health monitoring, control systems, and wearable medical devices. Vibration energy harvesting can be achieved by using electromechanical transducers such as electromagnetics, electrostatics or piezoelectrics [1]. Piezoelectric energy harvesting has received great attention due to the common usage and understanding of piezoelectric transducers in a wide range of applications including aerospace, mechanical, electrical, medical instrumentation and consumer electronics, either in sensing or actuation [2–4]. Piezoelectrics have the ability that generates an electric charge in response to applied mechanical stress, making it a suitable material for energy harvesting from vibration, which is abundant in environment. Yet, in general the piezoelectric energy harvesting is not efficient and the harvested power is low. Thus to yield useful power for practical applications, the harvester needs to be bulky or the vibration excitation level needs to be large. However, recent advances in microelectronics technologies have led to a reduction in power consumption of microelectromechanical wireless sensor systems, to the low mW level or even μW level, making piezoelectric energy harvesting a viable solution to self-powered wireless sensors [5].
Many earlier studies have used a general model proposed by Williams and Yates [6] that models the energy harvesting effect as a linear damper. While this is accurate for electromagnetic energy harvesters, it is not valid for piezoelectric energy harvesters (PEH) due to the electromechanical coupling effect, which is not proportional to the mechanical velocity. Many later studies have since used the electromechanically coupled actuator-sensor equations developed by Hagood et al [7] that accounts for this coupling effect. As most studies have adopted a single-degree-of-freedom (SDOF) model, many efforts have been focused on the distributed-to-lumped system modeling such as beams [8–11] and plates (membrane) [12–14].
Because most practical applications of energy harvesting involve DC-powered devices or energy storage components such as batteries or capacitors, a few energy harvesting circuit schemes have been proposed to convert the AC power to DC output. The common configuration is a standard interface consisted of an AC/DC rectifier and a smoothing filter. Mostly notably, Ottman et al [15] studied an uncoupled model that represented the vibrating structure as a current source in parallel with its internal capacitance, and assumed the structural response did not depend on the load. Guyomar et al [16] considered the coupling in their modeling and analysis, but assumed that the excitation was in-phase with the structural velocity response of the harvester. Shu and Lien [17] developed an improved model and analysis that considered both electromechanical coupling and the phase angle between the excitation and the response. To improve the power performance of weakly coupled energy harvesters, Guyomar et al [16] also proposed the synchronized switch harvesting on inductor (SSHI) interface circuit that could increase the harvested power by as much as four to nine times. Though their analysis was still under the in-phase assumption. Later Shu et al [18] proposed an analysis that considered the phase difference, and performed a detailed comparison of the standard (SEH) and SSHI interfaces in [19].
A common phenomenon shown by these models and observed in experiments is that the harvested power increases as the system electromechanical coupling increases. However, once the coupling reaches to a critical value, further increase does not lead to more power, i.e., the power saturates. In addition, for an energy harvester connected to different circuit interfaces, the saturated power level remains the same. Thus it appears that there exists an overall maximum power (power limit) that can be harvested by a particular energy harvester. The power characteristics of the harvester depend on the interface type, but the harvested power is capped by this power limit. Since the power output is the most important parameter of an energy harvester, it is meaningful to determine the power limit and the critical coupling to reach the limit. Williams and Yates [6] obtained an expression for the power limit. But as discussed previously, their model does not consider the electromechanical coupling effect of PEH, and does not model the physics of the PEH harvesters accurately. Recently Liao and Sodano [20] considered the coupling effect and performed an exact analysis of harvesters connected to resistive circuit interfaces. Interestingly they reached the same power limit expression as that obtained by Williams and Yates. In addition, Renno et al [21] studied the maximum possible power that could be obtained by harvesters having a RL circuit interface, and Liao and Sodano [22] studied the harvesters having a RC circuit interface, respectively. However, analytical is not possible for SEH and SSHI interfaces due to the nonlinearity of the circuits. Guyomar et al [16] conducted an analysis on the maximum power under the inphase and weak electromechanical coupling assumptions and did not consider the resonance frequency shift due to coupling. Generally low damping is desired for energy harvesters to yield relatively large structural response, resulting in more strain energy for conversion. In this case, a frequency deviation could lead to a significant reduction in power. Thus it cannot be neglected. In addition, Shu et al [17–19] performed an analysis on the maximum power without the inphase and weak electromechanical coupling assumptions. However, the discussion was focused on the short-circuit resonance and the open-circuit antiresonance and the power limit peaks occurs at frequencies in between.
This paper presents a detailed analysis on the power limit of energy harvesters connected to a generalized electrical load that unifies different circuit interfaces. The initial analysis is based on the electromechanically coupled equations. Then a separate analysis on the power limit is performed using the equivalent circuit of the system and the impedance matching technique. After that, the findings and results are applied to explain the behaviors of resistive (REH) and standard (SEH) energy harvesters, in particular, the critical electromechanical coupling to reach the power limit and the one-peak or the two-peak phenomenon of weakly coupled or strongly coupled harvesters, respectively, which has been explained clearly in literature. Finally, the behaviors of REH and SEH energy harvesters are compared and discussed through an impedance graph, which offers a helpful visualization of system behaviors.
2. Direct power analysis based on electromechanically coupled system equations
2.1. Modeling of a beam energy harvester
From the electromechanically coupled sensor/actuator equations defined by Hagood et al [7] for piezoelectric systems, a linear SDOF model of a PEH operating near its resonance can be obtained as:
where r is the temporal displacement, v is the voltage, q is the charge, and the effective system parameters M, K, C, θ, are mass, stiffness, damping, electromechanical coupling, capacitance, force, respectively. For discussion purposes, this paper uses beam energy harvesters as an example; however, the results can also be extended to other configurations, which essentially have the same form of governing equations except that the effective system parameters would be defined differently.
In the case of a beam energy harvester, Liao and Sodano [9] defined the effective system parameters as:
piezoelectric. The constant ζ is the mechanical (material) damping ratio of the system.
In the case of a beam harvester subjected to base excitation, the effective external force can be defined as
where a(t) is the acceleration of the clamped boundary condition resulting due to the attachment of the beam to a vibration source, and D is the effective input mass defined as
Physically, the base excitation is modeled and converted into a distributed load exerted along the beam.
2.2. Power limit analysis and optimal electrical load
Let be the impedance of the power harvesting electrical circuit. The voltage and charge are related by
Manipulation of equations (1), (2), and (6) yields:
from which the transfer function between the charge and acceleration is determined as
where is the density, c the modulus of elasticity, ε the dielectric constant, and e is the piezoelectric coupling coefficient. The subscripts and s, denote the piezoelectric material and the substrate, respectively. The superscript, , signifies the parameter was measured at constant strain, superscript, signifies the parameter was measured at constant stress, and the superscript, , indicates the parameter was measured at constant electric field. The and z coordinates are used to represent the length, thickness, and width directions of the beam, respectively. For the cases studied in this paper, the excitation force is applied in the direction resulting in a stress field in the x direction, and the electrical field is generated along the y direction, resulting a 31-mode beam energy harvesting configuration. j(x) is the mode shape function of the vibratory mode of interest, and ψ (y) denotes the electrical field over the thickness of the
Define the generalized impedance or load of the power harvesting circuit in terms of its resistance R and reactance X
Substitute (9) into (8) and the power dissipated in the power harvesting circuit, i.e., through the resistance R, can be obtained as
where
To find the optimal circuit impedance to obtain maximum power at a given excitation frequency, the power expression (10) can be differentiated with respect to the impedance variables R and X:
Relationship (12) leads to
Substituting expressions (11) into (14) and manipulations yield
which does not depend on the resistance R of the circuit impedance, interestingly. Similarly, relationship (13) leads to
from which the optimal resistance (squared) can be solved as harvesting circuit, i.e., impedance of the circuit. Thus it represents the power capacity of the harvester and will be called power limit in the rest of the paper. For the power limit analysis in this section, the two impedance components, i.e., R and X, were free real-valued variables that can be positive, negative or zero. However, physical circuits have constraints. For example, if the circuit is purely resistive, the resistance R is non-negative and the reactance X is zero. As a result, to reach the power limit, the numerator of the global reactance expression (18) needs to be zero. This means the power limit occurs only at particular frequencies, i.e., roots of the numerator expression, or it does not occur at all if no root exists. This will be discussed further in the next section using the impedance matching concept.
3. Equivalent circuit and impedance matching for maximum power generation
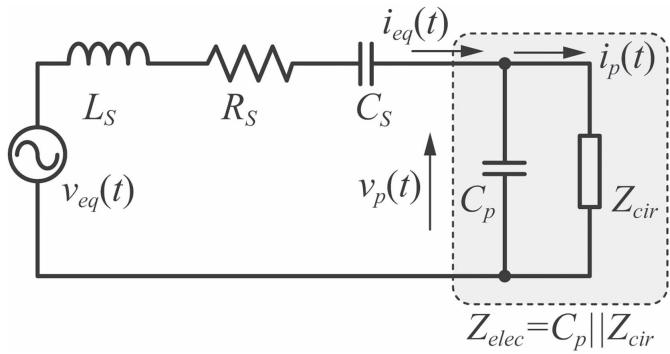
In the previous section, the power and optimal electrical load analysis are performed directly using the governing electromechanically coupled equations. In this section, the global optimal electrical load will be determined by using the impedance matching approach based on the equivalent circuit [23–26] of the system as shown in figure 2, which is obtained by using the electromechanical analogy. The analogy offers a
To obtain the overall global maximum power, both relationships need to be satisfied. The global optimal reactance is the same as the one given in equation (15) because it is independent of the resistance:
While the global optimal resistance can be obtained by substituting the global optimal reactance (18) into (17)
Substituting the global optimal resistance (19) and reactance (18) into equation (10) yields
which gives the maximum possible power output of the power harvester through tuning or design of the energy means of converting the mechanical components of an electromechanical system into the electrical domain. As a result, the system can be analyzed in the electrical domain entirely, where a large number of theories and techniques are available. The development of this equivalent circuit model can be carried out as follows. For a linear SDOF energy harvester subjected to base motion in terms of acceleration a(t), the coupled equations (1) and (2) can be rewritten as
The first equation of (21) can be rewritten as
Define the equivalent source voltage and current as
text_image
L_S R_S C_S i_eq(t) v_eq(t) v_p(t) i_p(t) C_p Z_cir Z_elec=C_p||Z_cir
Figure 1. Equivalent circuit of a piezoelectric energy harvester subjected to base excitation.
text_image
Z_S V_S Z_L
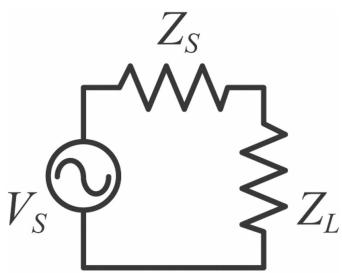
Figure 2. Schematic for impedance matching.
Substituting the equivalent expressions back into equation (22) yields
which is in the form of an electrical network consisting of four elements in series. Each term on the right-hand side of the equation represents a voltage drop across an equivalent electrical element. It can be seen that the first three terms are associated with inductance, resistance, and capacitance, respectively. As a result, the voltage relationship (24) is rewritten as
where the equivalent electrical elements are related to the original mechanical elements as
In addition to the voltage relationship (25), the current relationship can be obtained by rewriting the second equation of (21) as
Combining both relationships (25) and (27) yields the equivalent circuit shown in figure 1.
Then the impedance matching technique, a commonly used method in electronic analysis to maximize energy transfer from a source to the load, can be applied to provide additional perspectives on the power behavior, especially the power limit, of energy harvesters. Figure 2 shows the schematic of a general circuit that consists of a voltage source vS, source impedance , and load impedance . For complex impedances and the maximum power transferred to the load occurs when
where the asterisk signifies the complex conjugate. In the case of a resistive load impedance, the power transfer is maximized when the load impedance is equal to the magnitude of the source impedance, i.e.,
As Liang and Liao [23] pointed out, for impedance matching the source impedance and the load impedance should be connected in series as shown in figure 2. Thus when the impedance matching is performed for the energy harvesting system in figure 1, the intrinsic capacitance needs to be combined with the energy harvesting circuit, resulting in an equivalent electrical impedance (shaded in figure 1) as
The equivalent source impedance can be defined as
Applying the impedance matching relationship (28) to equation (31) yields the optimal or matched electrical impedance (including both and
which is an ‘intrinsic’ optimal property that depends on the parameters of the energy harvester only. In other words, it is independent of the energy harvesting circuit. The subscript ‘m’ signifies ‘matched’. The matched circuit impedance components can be obtained by equating equations (30) and (32), resulting in the following system of equations
To solve the nonlinear system, first, manipulate the two equations to cancel out the second-order terms and and we have
Substituting equation (35) into (33) yields
Then the matched reactance can be determined from equation (35):
Note that the optimal resistance and reactance expressions obtained through this impedance matching approach are the same as those obtained by performing a direct power analysis based on the coupled system dynamics equations in section 2 (see equations (18) and (19)). For manipulation conveniences, the optimal impedance components can also be expressed in terms of dimensionless variables as:
where the dimensionless variables frequency ratio, damping ratio, and effective electromechanical coupling coefficient are defined as
where is the short-circuit resonance frequency. Note that for piezoelectric vibration energy harvesters the impedance matching does not occur at Due to electromechanical coupling, the mechanical resonance frequency changes with the electrical load, i.e., increasing from the short-circuit resonance frequency to the open-circuit antiresonance frequency as the electrical load increases from zero to infinity. An experimental study on this phenomenon can be found in [27]. The open-circuit antiresonance frequency is related to the short-circuit resonance frequency through the electromechanical coupling coefficient as
The harvested power at either short-circuit or open-circuit is zero. Thus the maximum power is obtained at somewhere in between. As a result, in general the impedance matching or power limit occurs at a frequency (or frequencies) between and , not exactly. This will be clearly shown in sections 4 and 5. The matched impedance expressions (38) and (39) are in terms of the general excitation frequency ω and frequency ratio In other words, these expressions are general and they include the resonance frequency shifting effect. It is not assumed that the maximum power must occur at either the short-circuit resonance frequency or the opencircuit antiresonance frequency.
By using the equivalent electrical element parameters defined in equations (23) and (26), the power harvested (or dissipated) by the electrical impedance can be determined as
where the dimensionless resistance and reactance
Substituting the matched impedance components given in equations (38) and (39) into the power equation (42) yields the same power limit as given by expression (20).
In all, using the equivalent circuit analysis and impedance matching approach this section shows that PEH have a power limit that could be reached through an optimal (or matched) impedance of the energy harvesting circuit. The results agree with those obtained by using a direct power analysis based on the electromechanical dynamics equations of the system in section 2. However, physical energy harvesting circuits exert constraints on the system, which could prevent from reaching the power limit. In the next sections, the impedance matching concept along with its results will be applied to a resistive energy harvesting (REH) circuit and a standard energy harvesting (SEH) circuit, respectively, and used to study and explain their general power behaviors.
4. Power and impedance characteristics of a REH harvester
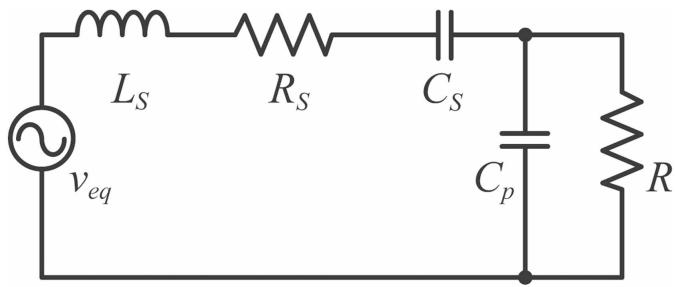
As discussed previously, the power limit of a harvester is reached when the equivalent electrical load impedance defined in equation (30) matches the equivalent source impedance defined in equation (31). As a result, the resistance and reactance of the energy harvesting circuit, i.e., need to be equal to the global optimal values given in expressions (38) and (39). This section applies the results to PEH connected with resistive circuits as shown in figure 3, which have been studied extensively for shunt damping applications. Although it is not an ideal configuration for energy harvesting applications, it has attracted great interests because it offers a start point to understand the mechanism and behavior of energy harvesters. For example, due to its simplicity, REH systems can be used to verify electromechanical system models before more practical and advanced circuitry is implemented. An interesting power characteristic [9, 10, 20] of REH harvesters, also shared by other types of harvesters, is that increasing the electromechanical coupling of a harvester leads to more power initially, and the maximum power output is obtained near the resonance of the system. But after the coupling reached a critical value, further increasing does not lead to an increase in the maximum power output, which appears to be saturated and occur at two excitation frequencies near the resonance and antiresonance of the system, respectively.
text_image
Ls Rs Cs veq Cp R
Figure 3. Equivalent circuit of a resistive energy harvester.
Since resistive energy harvesting circuits have a zero reactance component, based on equations (38) and (39) impedance matching to reach the power limit requires
for the resistance and reactance components, respectively. Equation (46) leads to a quadratic equation in terms of
Solving the equation yields
Real-valued exists only if the term inside the square root is non-negative, which leads to
Table 1. Geometry and material properties of the simulated system.
| Property | Symbol | Value |
| Length | $L$ | 76.2 mm |
| Width | $b$ | 12.7 mm |
| Copper thickness | $t_s$ | 0.254 mm |
| PZT thickness | $t_p$ | 0.254 mm |
| Copper density | $ρ_s$ | 8960 kg m $^{-3}$ |
| PZT density | $ρ_p$ | 7800 kg m $^{-3}$ |
| Copper modulus | $c_s$ | 117 GPa |
| PZT modulus | $c_p$ | 62 GPa |
and the associated real-valued and positive frequency ratios are
Based on equation (49), the power behavior of REH harvesters can be categorized into three types based on the relationship between the effective electromechanical coupling coefficient and mechanical damping:
For strongly coupled harvesters, the global optimal impedance is matched at two particular excitation frequency ratios and and the power limit is reached at these two frequencies. In the case of critically coupled harvesters, the optimal impedance is still matched at two identical frequency ratios, i.e., . However, if the electromechanical coupling is weak, no real-valued and non-negative root of r exists and the power limit cannot be reached through the tuning of the resistive circuit.
To illustrate this behavior graphically, a bimorph power harvester is simulated with the material and geometry properties given in table 1. The substrate copper layer is placed between two piezoelectric layers connected in parallel electrically. First the effective system parameters in equations (3) and (5) are determined, from which the power output is calculated. The harvester operates near the first short-circuit natural frequency and has mechanical (material) damping . The electromechanical properties of the PZT material are given in the form of the overall effective coupling coefficient of the system for comparison purposes.
The power output of a harvester connected with a resistive circuit can be determined from equation (10) by noting the energy harvesting reactance in this case:
The optimal resistance to maximize the power at a given excitation frequency can be obtained by differentiating this power expression:
Note that this optimal resistance is different from the global optimal resistance given in equation (19) or the matched resistance given in equation (36), because the former is obtained with the constraint that the reactance of the resistive energy harvesting circuit is zero, while the latter is obtained with the reactance being free.
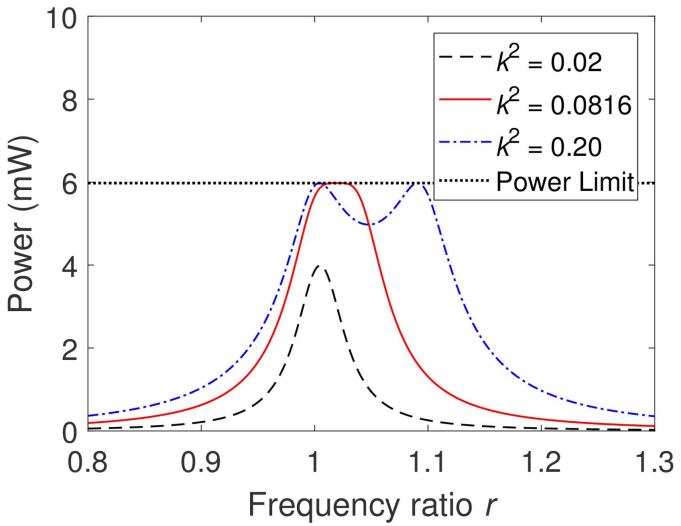
Figure 4 shows the harvested power at the optimal resistance as a function of excitation frequency ratio for harvesters of three different electromechanical couplings as defined in expression (51), i.e., strong , critical , and weak , respectively. In the case of weak coupling, the optimal power curve has a peak near the resonance of the system but the peak value is below the power limit. In the case of critical coupling, the optimal power curve is also of a one-peak shape but reaches the power limit at a frequency near the resonance. The strong coupling power curve has two peaks at the power limit, one near the resonance and the other one near the antiresonance of the system, respectively.
The behavior of those power curves can be explained by using the impedance matching concept presented and discussed in section 3. Figure 5 plots the matched (or global optimal) circuit impedance at different frequencies for the three harvesters of different electromechanical coupling. As the frequency increases, the matched impedance moves along the curve in the counterclockwise direction. Note that since the energy harvesting circuit is purely resistive, tuning of the circuit corresponds to moving the impedance along the horizontal resistance axis, on which the reactance is zero. In the case of weak coupling, the matched impedance is represented by the dashed black curve covering a small elliptical area above the horizontal axis on the left. There is not any intersection between the matched impedance curve and the horizontal axis. Therefore, the power limit is not reached through tuning, and the peak on the dashed power curve in figure 4 falls below the limit. In the case of strong coupling represented by the dash-dot blue curve in figure 5, there are two intersection points between the matched impedance curve and the horizontal resistance axis. Thus, the power limit is reached at these two locations, and as given in equation (50) for , resulting in the two peaks at the power limit on the dash-dot power curve in figure 4. In addition, equation (45) gives the matched resistance to be 2.792 and 53.35 kΩ, which agrees with what is shown in figure 5. Finally, the matched impedance in the case of critical coupling is represented by the solid red curve in figure 5. It can be seen that the horizontal resistance axis is tangential to this matched impedance curve at the bottom. In other words, there exists just one intersection point between the two curves, and the power limit is reached at this particular frequency , as given by equation (50) for . As a result, the solid red power curve in figure 4 has a single peak at the power limit.
line
| Frequency ratio r | Power (mW) for k² = 0.02 | Power (mW) for k² = 0.0816 | Power (mW) for k² = 0.20 |
|---|---|---|---|
| 0.8 | ~0 | ~0 | ~0 |
| 0.9 | ~0.5 | ~1 | ~1.5 |
| 1.0 | ~4 | ~6 | ~6 |
| 1.1 | ~0 | ~2 | ~5 |
| 1.2 | ~0 | ~0.5 | ~1 |
| 1.3 | ~0 | ~0 | ~0 |
Figure 4. Power at optimal resistance versus frequency ratio. Strong coupling, critical coupling, weak coupling, . Power limit given in equation (20). Mechanical damping ratio . Base excitation acceleration at .
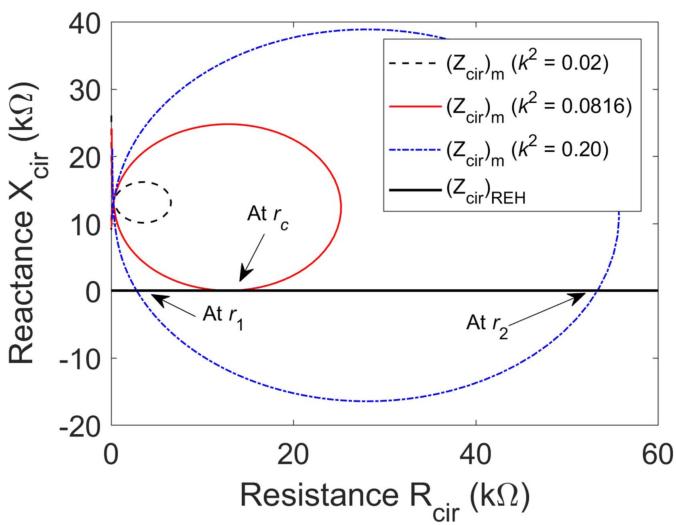
Figure 5. Matched (optimal) circuit impedance and REH circuit tuning impedance . Strong coupling, critical coupling, 16; weak coupling, . Mechanical damping ratio .
It is worthwhile to point out the relationship between the maximum harvested power, i.e., power limit, and the maximum energy conversion efficiency, two important parameters of an energy harvester. Liao and Sodano investigated on the general relationship in [28] and recently Kim and et al performed a more detailed analytical analysis in [29]. Overall, for weakly coupled systems, the harvested power and efficiency increase simultaneously as the electromechanical coupling increases. As the coupling increases beyond its critical value, the maximum power, i.e., power limit, and maximum energy efficiency are not obtained at the same time. Physically, a higher energy efficiency corresponds to higher induced electrical damping to the structure, resulting in reduced mechanical energy for harvesting. In other words, maximizing the efficiency maximizes the damping to the system. For strongly coupled systems, this reduction in mechanical energy due to damping is more significant than the increase in energy conversion efficiency. As a result, the overall harvested power at the maximized energy efficiency actually becomes smaller.
5. Power and impedance characteristics of a SEH harvester
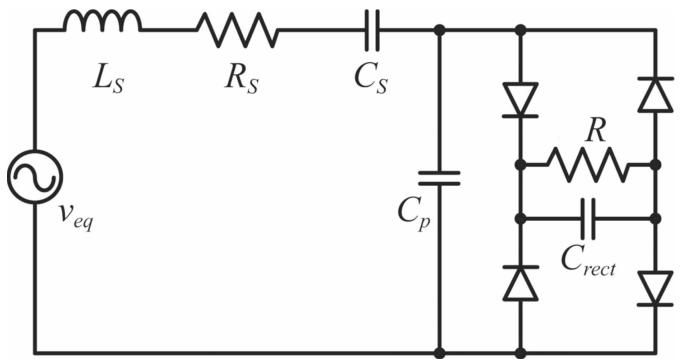
As most practical energy harvesting applications involve DCpowered devices, and/or charging batteries or capacitors, the standard energy harvesting circuit is a more useful configuration that converts the AC power to a stable DC output. Figure 6 shows the schematic of a standard energy harvester, which consists of a rectifier bridge and a smoothing capacitor Ottman et al [15] and Guyomar et al [16] presented early models and analysis of the SEH circuit interface. Later Shu and Lien [17] developed a more accurate model. However, due to the nonlinearity nature of the circuit, the relationships between the system parameters and performance are not readily apparent. To simplify the analysis and unify different circuit interfaces, Liang and Liao [23] developed an equivalent impedance of a standard energy harvester by approximating the nonlinear voltage and current in the circuit using the fundamental harmonics.
The equivalent electrical impedance of the shaded region in figure 1 that combines the energy harvesting circuit and the intrinsic capacitance of the piezoelectric patches was obtained as
where
and and are the rectified voltage and open-circuit voltage, respectively. is the rectifier blocked angle in a half cycle, which changes between 0 and π as the load resistance changes, i.e., turning. Details of this equivalent impedance modeling can be found in Liang and Liao [23]. The harvested power can be determined from equations (42) and (54) by noting that in this case the dimensionless resistance and reactance in equation (42) are related to the rectifier blocked angle as:
text_image
Ls Rs Cs veq Cp R Crect
Figure 6. Equivalent circuit of a standard energy harvester.
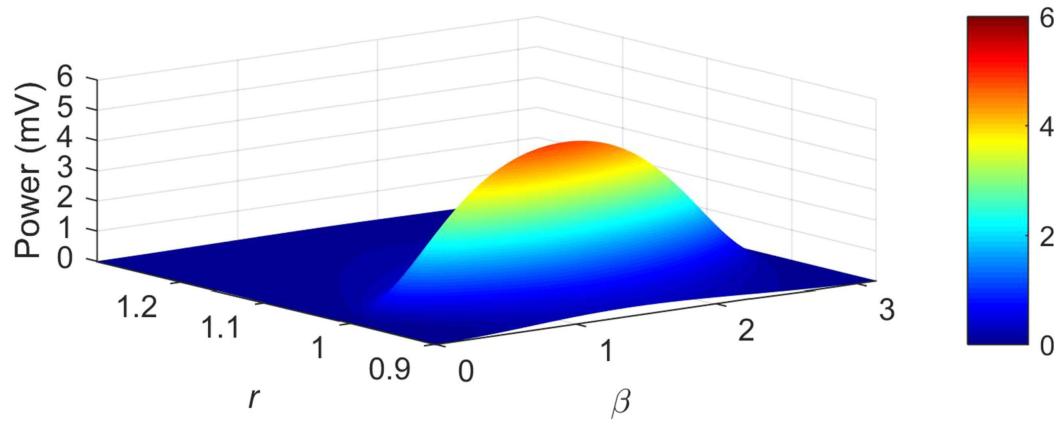
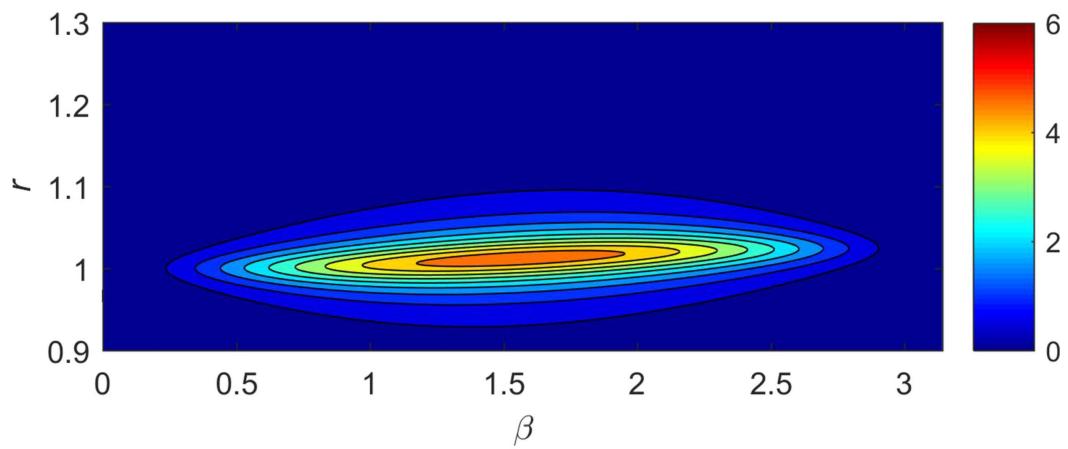
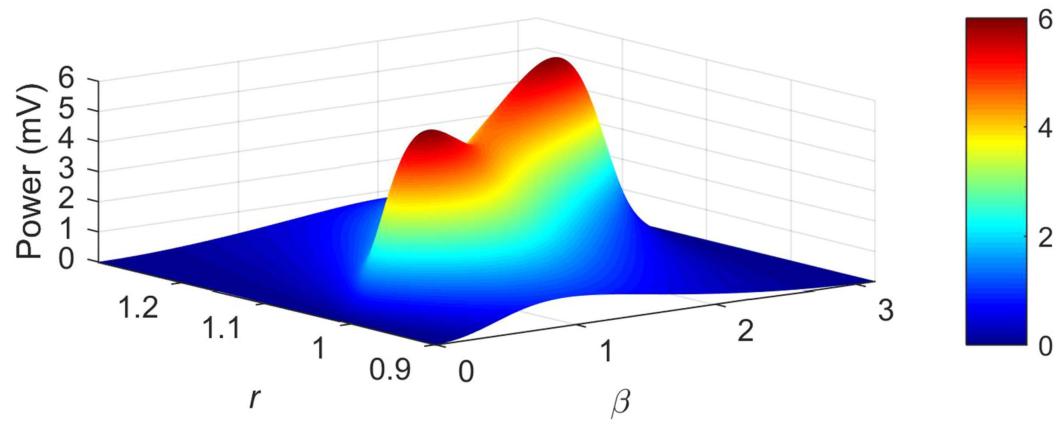
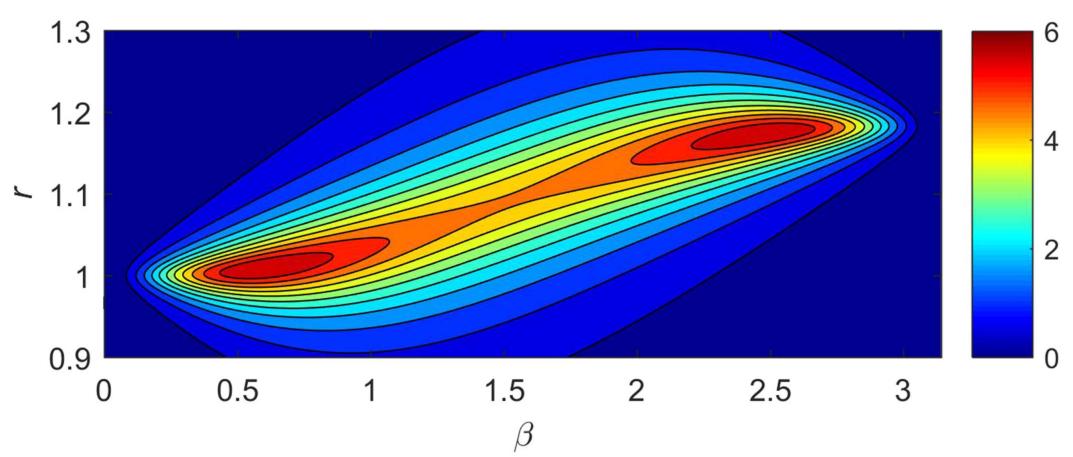
Figure 7 plots the harvested power against the excitation frequency ratio r and block angle for a harvester having effective coupling coefficient . Note that varying the value of corresponds to tuning the energy harvesting circuit. It can be seen that there exists an overall power peak but it is below the power limit at 5.96 mW determined by equations (20) or (44). On the other hand, figure 8 plots the harvested power for a harvester having effective coupling coefficient . There are two peaks where the power limit is reached at frequency ratios 1.0085 (near the resonance, and 1.1741 (near the antiresonance, 1.1832), respectively. It can be shown that further increase of the coupling coefficient does not lead to additional peaks. The number of peaks remains as two and the peak power is capped to be equal to the power limit. The locations of the peaks do change and the distance in between becomes longer as the coupling coefficient increases.
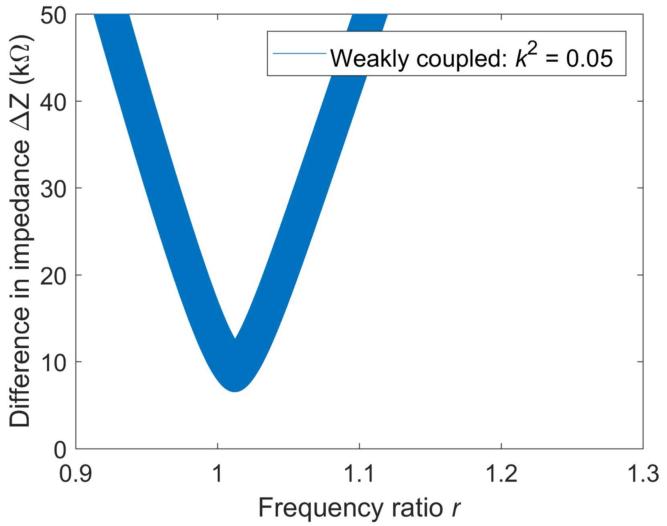
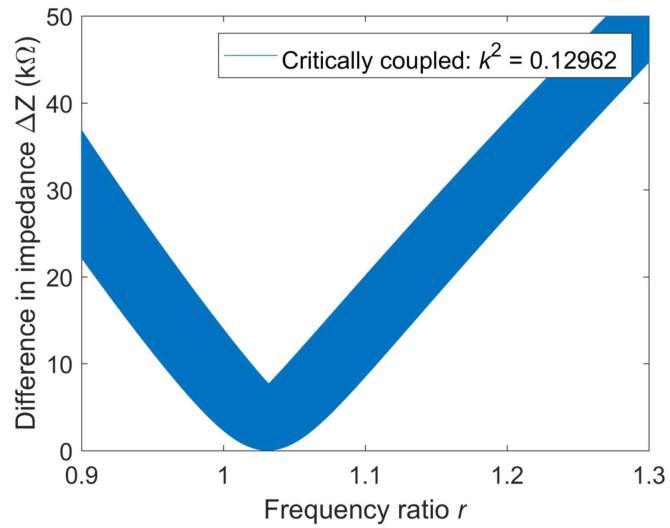
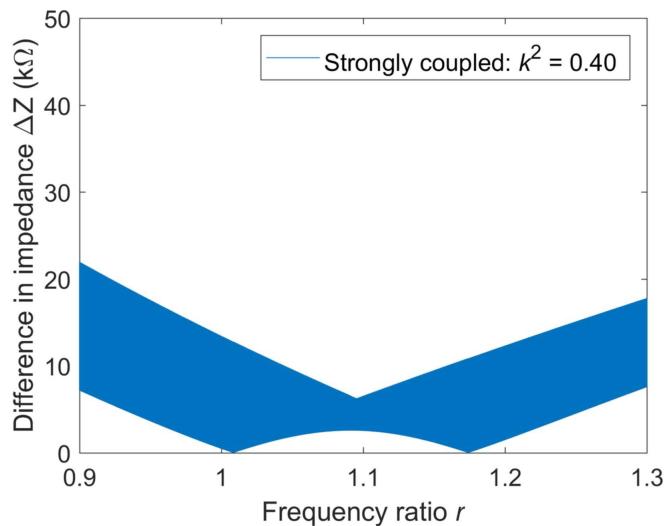
To study the relationship between the power limit peaks and the impedance of the circuit, figure 9 plots the difference between the circuit impedance and the matched (or optimal) impedance for harvesters of three different effective coupling coefficients, which is defined as
where the and are the equivalent electrical impedance defined in equation (54) for SEH harvesters, and and are the matched electrical impedance defined in equation (32) to reach the power limit, respectively. Note that the equivalent electrical impedance depends on both frequency ω and rectifier blocked angle while the matched optimal electrical impedance depends on frequency ω only. To obtain figure at each frequency ratio the blocked angle is varied from 0 to π at a very small step size. Then for each value of the impedance difference ΔZ is calculated. Thus graphically at each r there are multiple data points, resulting in a ‘shaded’ area due to the large number of points plotted together. It can be seen from figure 9(a) that in the case of weak coupling , the difference is always great than zero regardless of the frequency ratio and blocked angle. In other words, the electrical impedance is not able to be tuned to the matched electrical impedance. As a result, although there exists a peak in power as shown in figure 7, the power limit is not reached. As the effective coupling coefficient increases to , i.e., critical coupling, the impedance difference becomes is zero at a single frequency ratio , where the electrical impedance is equal to the matched impedance, resulting a single power limit peak in power. As the coupling increases further, the electrical impedance is able to match the optimal impedance at two locations, for example, as shown in figure 9(c) for . This leads to two power limit peaks in power as shown in figure 8. These power behaviors agree with previous analysis results in sections 2 and 3 that the power limit represents the maximum possible power output of a harvester through impedance tuning, and it can be obtained only when the electrical impedance is tuned to the matched intrinsic electrical impedance of the system.
area_stacked
| r | β | Power (mV) |
|---|---|---|
| 1.2 | 0 | 0 |
| 1.1 | 0.9 | 1 |
| 1 | 1 | 2 |
| 0.9 | 1.5 | 3 |
| 0 | 2 | 4 |
| 1 | 2.5 | 5 |
| 2 | 3 | 0 |
heatmap
| β | r | Value |
|---|---|---|
| 0.5 | 1.0 | 2 |
| 1.0 | 1.0 | 4 |
| 1.5 | 1.0 | 6 |
| 2.0 | 1.0 | 4 |
| 2.5 | 1.0 | 2 |
| 3.0 | 1.0 | 0 |
Figure 7. Harvested power versus frequency ratio r and blocked angle β for SEH harvesters. Small electromechanical coupling coefficient . Mechanical damping ratio . Power limit mW.
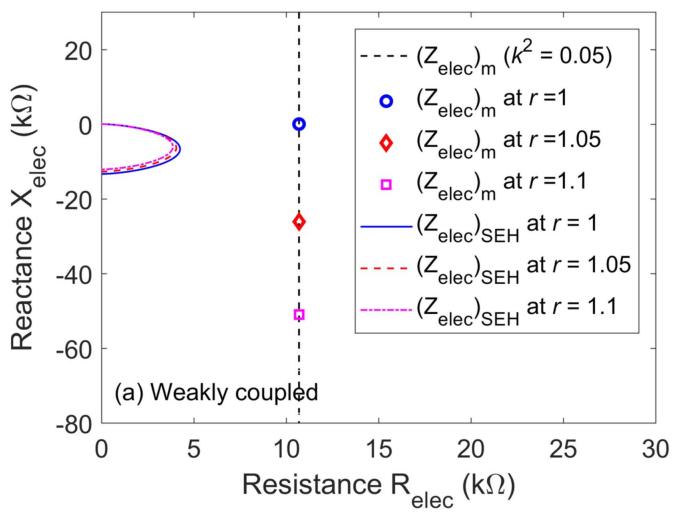
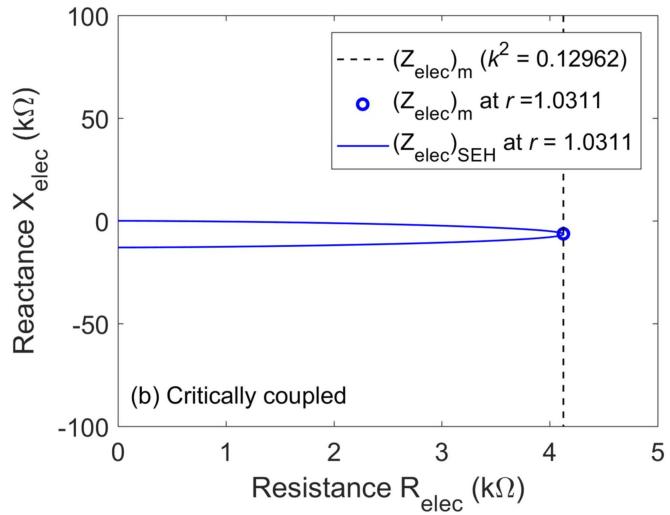
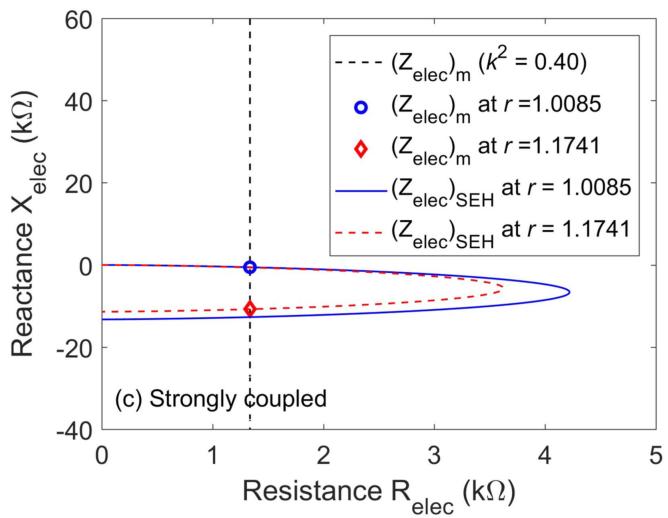
Figure 10 provides a graphical view of the movement of the electrical impedance during tuning and its relationship to the matched optimal electrical impedance. Note that the matched optimal electrical impedance given by equation (32) depends on the frequency ratio r. As r increases, the optimal impedance moves along the vertical curve in the downward direction. The equivalent impedance of the SEH circuit, given in equation (54), depends on both r and β. To show the dependence on both parameters, each curve is plotted for a particular frequency ratio, and then as varies from 0 to , the corresponding electrical impedance point moves along the curve in the clockwise direction. In the case of weak coupling, i.e., figure 10(a), the electrical impedance curves are not able to intersect the matched impedance curve. It is important to point out that even if the and curves are able to intercept each other, the interception point needs to be at the same frequency ratio for the impedances to be really matched. This is shown in figure 10(c), the case of strong coupling. In that case it can be seen that the curve is able to intercept the curve at two locations, where the frequency ratios for the two curves are equal. In other words, the impedances are matched are these two frequencies, resulting in two power limit peaks. In the case of critical coupling as shown in figure 10(b), the curve is able to ‘intercept and match’ the curve at a single frequency ratio, where the two curves are tangential to each other.
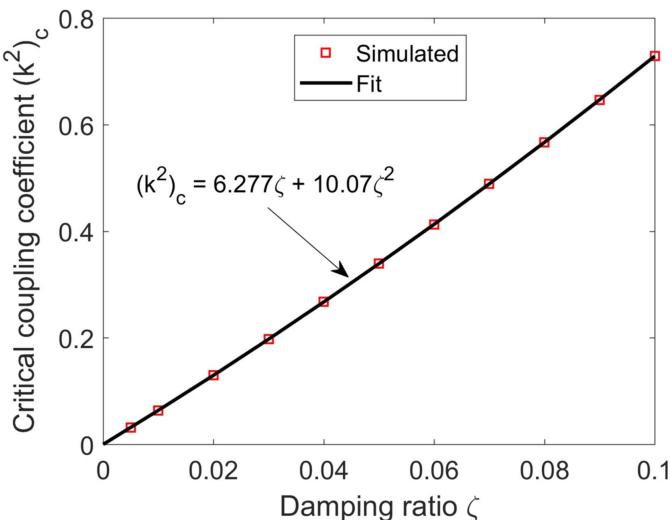
The behavior of SHE harvesters of different coupling is demonstrated in figures 7 and 8. The transition or critical coupling is determined to be through simulations. To help analyze and design SEH harvesters, it is desirable to obtain a closed-form criterion similar to equation (51), where the coupling efficient is compared to the mechanical damping of the system to determine the type of the coupling, i.e. weakly, critically, and strongly and obtain the maximum power output, i.e., power limit. However, analytical derivation is not possible in this case. Numerical studies have been performed to obtain the relationship between the critical coupling and the damping ratio as shown in figure 11. From the simulation results, a fit expression similar to equation (51) is obtained as
area_stacked
| r | β | Power (mV) |
|---|---|---|
| 1.2 | 0 | 0 |
| 1.1 | 0.9 | 2 |
| 1 | 1 | 4 |
| 0.9 | 1.1 | 5 |
| 0 | 1.2 | 6 |
| 0 | 1.3 | 5 |
| 0 | 1.4 | 4 |
| 0 | 1.5 | 3 |
| 0 | 1.6 | 2 |
| 0 | 1.7 | 1 |
| 0 | 1.8 | 0 |
| 0 | 1.9 | 0 |
| 0 | 2 | 0 |
| 0 | 2.1 | 0 |
| 0 | 2.2 | 0 |
| 0 | 2.3 | 0 |
| 0 | 2.4 | 0 |
| 0 | 2.5 | 0 |
| 0 | 2.6 | 0 |
| 0 | 2.7 | 0 |
| 0 | 2.8 | 0 |
| 0 | 2.9 | 0 |
| 0 | 3 | 0 |
heatmap
| β | γ | Value |
|---|---|---|
| 0.0 | 0.9 | 0 |
| 0.5 | 1.0 | 2 |
| 1.0 | 1.1 | 4 |
| 1.5 | 1.2 | 6 |
| 2.0 | 1.3 | 6 |
| 2.5 | 1.2 | 4 |
| 3.0 | 1.1 | 2 |
Figure 8. Harvested power versus frequency ratio r and blocked angle β for SEH harvesters. Large electromechanical coupling coefficient . Mechanical damping ratio . Power limit mW.
For low damping, this means that the critical coupling efficient is about 6.28 times of the mechanical damping. A separate analysis was performed using the SEH model developed by Shu and Lien [17] and the relationship was determined as , which is fairly close to expression (58).
It is interesting that the numerical value 6.277 in expression (58) is very close to 2π. An analytical study on the relationship between the critical coupling coefficient and mechanical damping can be performed by first rewriting the matched optimal electrical impedance given by equation (32) as
To reach the power limit, the SEH electrical impedance in (54) needs to be equal to the matched electrical impedance in (59). This leads to
It can be shown that the right-hand side of equation (61) is always less than or equal to zero for between 0 and π. Note that when it is equal to zero, β must be equal to zero and r must be equal to one, and then equation (60) cannot be satisfied. Thus the right-hand side of equation (61) needs to be negative to yield feasible solutions. As a result, the power limit frequency ratio should be greater than one. In addition, equation (60) can be rewritten as
Since the power limit frequency ratio is greater than one and the magnitude of the sine function is always smaller than or equal to one, to yield the power limit or to have both (60) and (61) satisfied, the critical coupling coefficient
line
| Frequency ratio r | Difference in impedance ΔZ (kΩ) |
|---|---|
| 0.9 | 50 |
| 1.0 | 7 |
| 1.1 | 50 |
| 1.2 | 45 |
| 1.3 | 40 |
area
| Frequency ratio r | Difference in impedance ΔZ (kΩ) |
|---|---|
| 0.9 | 37 |
| 1.0 | 0 |
| 1.1 | 25 |
| 1.2 | 40 |
| 1.3 | 50 |
area
| Frequency ratio r | Difference in impedance ΔZ (kΩ) |
|---|---|
| 0.9 | 22 |
| 1.0 | 0 |
| 1.1 | 6 |
| 1.2 | 0 |
| 1.3 | 18 |
Figure 9. Difference in electrical impedance through tuning and matched electrical impedance for SEH harvesters. (a) Weakly coupled, (b) critically coupled, (c) strongly coupled, . Mechanical damping ratio .
Note this means that the critical coupling coefficient needs to be greater than It still does not provide a closedform relationship between the critical coupling coefficient and the mechanical damping ratio. However, based on the result given in (58), the ratio 2π appears to be a reasonable reference for SEH harvesters.
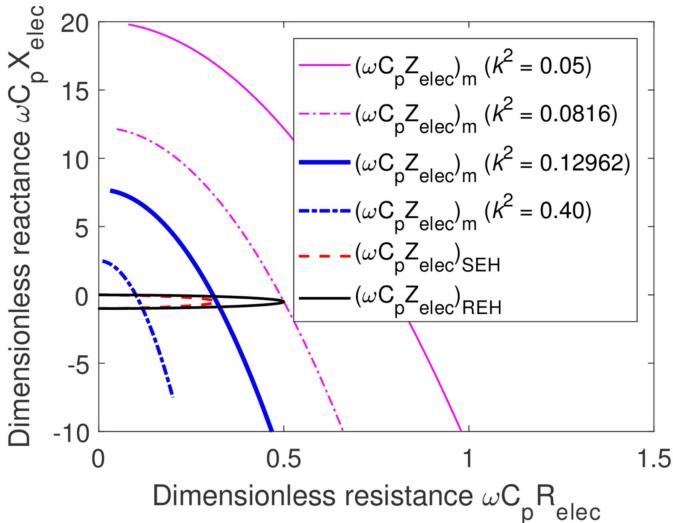
Lastly, the behaviors of REH and SEH harvesters and their coupling characteristic are compared in figure 12 in terms of the electrical impedance . Note that the electrical impedance is defined as a parallel combination of the energy harvesting circuit impedance and the piezoelectric capacitance as in equation (30). In the case of a REH circuit, the electrical impedance
where
It can be seen from equation (64) that the electrical impedance of REH harvesters depends on both and As discussed previously and given in equation (54), the electrical impedance of SEH harvesters depends on both ω and For comparison purposes and a better illustration of the relationships, the matched, SEH and REH electrical impedances are multiplied by resulting in the following dimensionless impedances
each of which depends on just a single variable given the system coupling coefficient and damping ratio. Figure 12 illustrates how the impedances change and are compared. At a particular coupling coefficient, as the frequency ratio increases, the dimensionless matched electrical impedance moves along the curve in the clockwise direction. For the dimensionless SEH electrical impedance , as the blocked angle increases (or tuned), the SEH electrical impedance moves along the curve in the clockwise direction. In the case of dimensionless REH electrical impedance , as increases (or tuned), the REH electrical impedance moves along the curve in the clockwise direction as well. To reach the power limit, the SEH or REH curve needs to intersect the matched impedance curve.
scatter
| Resistance R_elec (kΩ) | Reactance X_elec (kΩ) | Series |
|---|---|---|
| 10 | 0 | (Z_elec)_m at r = 1 |
| 10 | -25 | (Z_elec)_m at r = 1.05 |
| 10 | -50 | (Z_elec)_m at r = 1.1 |
line
| Resistance R_elec (kΩ) | Reactance X_elec (kΩ) |
|---|---|
| 4 | 0 |
line
| Resistance R_elec (kΩ) | Reactance X_elec (kΩ) - (Z_elec)_m at r=1.0085 | Reactance X_elec (kΩ) - (Z_elec)_m at r=1.1741 |
|---|---|---|
| 1.0 | 0 | -10 |
Figure 10. Circuit impedance and matched impedance for SEH harvesters. (a) Weakly coupled, (b) critically coupled, ; (c) strongly coupled, Mechanical damping ratio .
For either type of harvesters, if the coupling coefficient is small, e.g., , the optimal matched impedance curve is away from the electrical impedance tuning curve of the interface, i.e., REH or SEH. There exists just one power peak through tuning as shown in figure 7. Since the optimal matched impedance curve does not intersect either the REH or SEH electrical impedance tuning curve, this peak power is below the power limit. When the coupling coefficient increases to , the matched impedance curve touches the REH tuning curve at a single location, resulting in a critically coupled configuration for the REH harvester. However, this coupling is still too low for the SEH harvester. As the coupling increases further and reaches , the matched impedance curve is able to make contact with the SEH tuning electrical impedance curve, resulting in a critically coupled configuration for the SEH harvester. After that, the coupling is strong enough for both REH and SEH harvesters, e.g., and there are two intersection points between the electrical impedance curve and the optimal matched impedance curve, resulting in two power limit peaks. It is worthwhile to point out that the two SEH intersection points always fall between the two REH intersection points as the SEH impedance curve is enclosed inside by the REH impedance curve. Therefore, the ‘bandwidth’ between the two power limit frequencies of a SEH harvester is narrower than that of a REH harvester. In all, though SEH harvesters are more practical for energy harvesting applications, it requires stronger coupling to reach the power limit and the frequency bandwidth for large power output is not as wide as that of REH harvesters given the same strong electromechanical coupling.
line
| Damping ratio ζ | Critical coupling coefficient (k²)_c |
|---|---|
| 0.00 | 0.00 |
| 0.01 | 0.05 |
| 0.02 | 0.10 |
| 0.03 | 0.15 |
| 0.04 | 0.20 |
| 0.05 | 0.25 |
| 0.06 | 0.30 |
| 0.07 | 0.35 |
| 0.08 | 0.40 |
| 0.09 | 0.45 |
| 0.10 | 0.50 |
Figure 11. Critical coupling coefficient versus mechanical damping ratio ζ for SEH harvesters.
line
| Dimensionless resistance ωC_p R_elec | (ωC_p Z_elec)_m (k² = 0.05) | (ωC_p Z_elec)_m (k² = 0.0816) | (ωC_p Z_elec)_m (k² = 0.12962) | (ωC_p Z_elec)_m (k² = 0.40) | (ωC_p Z_elec)_SEH | (ωC_p Z_elec)_REH |
|---|---|---|---|---|---|---|
| 0 | 20 | 12 | 8 | 3 | 0 | 0 |
| 0.5 | 12 | 8 | 4 | 0 | 0 | 0 |
| 1.0 | 0 | -10 | -10 | -10 | -10 | -10 |
| 1.5 | -10 | -10 | -10 | -10 | -10 | -10 |
Figure 12. Dimensionless electrical impedances of REH and SEH harvesters, and optimally matched electrical impedance.
Lastly, as mentioned previously, the SSHI energy harvesting interface has received significant attention as an effective technique to improve the power performances of weakly coupled system. It was first proposed by Guyomar et al [16] based on the synchronized switch damping (SSD) technique [30] used to reduce structural vibration using piezoelectric damping. The SSD technique uses a small inductor for the inversion of the voltage on the piezoelectric element when the structural displacement reaches its maximum and minimum. As a result, the voltage was 90 degrees out of phase with the structural motion, resulting in enhanced damping. Guyomar et al [16] developed an energy harvesting model assuming that the excitation was perfectly in-phase with the structural velocity response of the harvester. Shu et al [18] presented an improved analysis that considered the actual phase difference between the excitation and the velocity response.
Similar to the SEH interface, Liang and Liao [23] were able to determine the equivalent impedance of the SSHI interface and validated its accuracy for power analysis experimentally. Since the power limit exists for all interfaces that can be represented as a generalized impedance, the power limit concept applies to the SSHI interface too. This was further confirmed by numerical studies using the model of Shu et al [18], which yielded the same saturated power of 5.96 mW, i.e., power limit. In addition to SSHI, there have been many other switched techniques proposed in recent years. A detailed discussion and comparison of switched techniques are a part of the future work that aims to provide a general and unified analysis of different types of energy harvesters.
6. Conclusions
The power limit of a PEH and the optimal circuit impedance reach the limit are obtained through two different analysis approaches: (1) direct power analysis based on the electromechanically coupled system equation; (2) impedance matching analysis based on the equivalent circuit model. Though the approaches are different, they arrive at the same results. The power limit represents the maximum possible power that can be harvested from a PEH. To reach this power limit, the effective electromechanical coupling coefficient of the harvester needs to be equal or greater than a critical value, making it possible for the impedance of the energy harvesting circuit to be tuned to the optimal impedance of the harvester.
However, physical energy harvesting circuits have constraints, which prevent them from obtaining the power limit freely. Impedance analysis is performed on resistive (REH) and SEH harvesters and is used to explain their one-peak and two-peak power behaviors and their constraints on the power limit.
In general, the energy harvesting circuit impedance of a weakly coupled REH or SEH harvesters is not able to be tuned to the optimal impedance. It has an overall power peak through tuning but this peak is below the power limit. A critically coupled harvester can reach the power limit at just a particular frequency. A strongly coupled harvester can achieve this at two particular frequencies, resulting two power limit peaks.
It has been found that the critical coupling coefficient is about four times of the mechanical damping ratio for REH harvesters, and it is about 2π times for SEH harvesters. In addition, the frequency bandwidth between the two power limit frequencies of a SEH harvester is narrower than that of a REH harvester given the same level of strong electromechanical coupling.
ORCID iDs
Yabin Liao https://orcid.org/0000-0003-4054-5219
Junrui Liang https://orcid.org/0000-0003-2685-5587
References
[1] Wei C F and Jing X J 2017 A comprehensive review on vibration energy harvesting: modelling and realization Renew. Sustain. Energy Rev. 74 1–18
[2] Sodano H A, Park G and Inman D J 2004 A review of power harvesting using piezoelectric materials Shock Vib. Dig. 36 197–206
[3] Anton S R and Sodano H A 2007 A review of power harvesting using piezoelectric materials (2003–2006) Smart Mater. Struct. 16 R1–21
[4] Priya S et al 2017 A Review on piezoelectric energy harvesting: materials, methods, and circuits Energy Harvesting Syst. 4 3-60
[5] Bogue R 2013 Energy harvesting and wireless sensors: a review of recent developments Sensor Rev. 29 194–9
[6] Williams C B and Yates R B 1996 Analysis of a micro-electric generator for microsystems Sensors Actuators 52 8–11
[7] Hagood N W, Chung W H and Von Flotow A 1990 Modeling of piezoelectric actuator dynamics for active structural control J. Intell. Mater. Syst. Struct. 1 327–54
[8] Erturk A and Inman D J 2008 A distributed parameter electromechanical model for cantilevered piezoelectric energy harvesters J. Vib. Acoust. 130 041002
[9] Liao Y and Sodano H A 2008 Model of a single mode energy harvester and properties for optimal power generation Smart Mater. Struct. 17 065026
[10] duToit N E, Wardle B L and Kim S G 2005 Design considerations for MEMS-scale piezoelectric mechanical vibration energy harvesters Integr. Ferroelectr. 71 121–60
[11] Dietl J M, Wickenheiser A M and Garcia E 2008 A Timoshenko beam model for cantilevered piezoelectric energy harvesters J. Vib. Acoust. 130 041002
[12] Cho J H, Anderson M, Richards R, Bahr D and Richards C 2005 Optimization of electromechanical coupling for a thinfilm PZT membrane: I. Modeling J. Micromech. Microeng. 15 1797–803
[13] Kim S, Clark W W and Wang Q M 2005 Piezoelectric energy harvesting with a clamped circular plate: analysis J. Intell. Mater. Syst. Struct. 16 847–54
[14] Yang J, Chen Z and Hu Y T 2007 An exact analysis of a rectangular plate piezoelectric generator IEEE Trans. Ultrason. Ferroelectr. Freq. Control 54 190–5
[15] Ottman G K, Hofmann H F, Bhatt A C and Lesieutre G A 2002 Adaptive piezoelectric energy harvesting circuit for wireless remote power supply IEEE Trans. Power Electron. 17 669–76
[16] Guyomar D, Badel A, Lefeuvre E and Richard C 2005 Toward energy harvesting using active materials and conversion improvement by nonlinear processing IEEE Trans. Ultrason. Ferroelectr. Freq. Control 52 584–95
[17] Shu Y C and Lien I C 2006 Analysis of power outputs for piezoelectric energy harvesting systems Smart Mater. Struct. 15 1499–502
[18] Shu Y C, Lien I C and Wu W J 2007 An improved analysis of the SSHI interface in piezoelectric energy harvesting Smart Mater. Struct. 16 2253–64
[19] Lien I C, Shu Y C, Wu W J, Shiu S M and Lin H C 2010 Revisit of series-SSHI with comparisons to other interfacing circuits in piezoelectric energy harvesting Smart Mater. Struct. 19 125009
[20] Liao Y and Sodano H A 2018 Optimal power, power limit and damping of vibration piezoelectric power harvesters Smart Mater. Struct. accepted (https://doi.org/10.1088/1361- 665X/aabf4a)
[21] Renno J M, Daqaq M F and Inman D J 2009 On the optimal energy harvesting from a vibration source J. Sound Vib. 320 386–405
[22] Liao Y and Sodano H A 2009 Optimal parameters and power characteristics of piezoelectric energy harvesters with an RC circuit Smart Mater. Struct. 18 045011
[23] Liang J and Liao W H 2012 Impedance modeling and analysis for piezoelectric energy harvesting systems IEEE Trans. Mechatronics 17 1145–57
[24] Yang Y W and Tang L H 2009 Equivalent circuit modeling of piezoelectric energy harvesters J. Intell. Mater. Syst. Struct. 20 2223–35
[25] Tilmans H A C 1996 Equivalent circuit representation of electromechanical transducers: I. Lumped-parameter systems J. Micromech. Microeng. 6 157–76
[26] Elvin N G and Elvin A A 2009 A general equivalent circuit model for piezoelectric generators J. Intell. Mater. Syst. Struct. 20 3–9
[27] Liao Y and Sodano H A 2010 Piezoelectric damping of resistively shunted beams and optimal parameters for maximum damping J. Vib. Acoust. 132 041014
[28] Liao Y and Sodano H A 2009 On structural effects and energy conversion efficiency of power harvesting J. Intell. Mater. Syst. Struct. 20 505–14
[29] Kim M, Dugundji J and Wardle B L 2015 Efficiency of piezoelectric mechanical vibration energy harvesting Smart Mater. Struct. 24 055006
[30] Richard C, Guyomar D, Audigier D and Bassaler H 2000 Enhanced semi passive damping using continuous switching of a piezoelectric device on an inductor Proc. SPIE 3989 288–99