Investigation of bending and crush behaviors in polymer lattice structures: Computational approaches and experimental evaluation
Journal of Reinforced Plastics and
Composites
2025, Vol. 44(23-24) 2981–2995
© The Author(s) 2024
Article reuse guidelines:
sagepub.com/journals-permissions
DOI: 10.1177/07316844241273043
journals.sagepub.com/home/jrp
Reza Shamim
Abstract
This paper aims to evaluate the manufacturing feasibility of using Fused Deposition Modeling (FDM) 3D printing for creating complex lattice structures and exploring the mechanical properties of various lattice designs, focusing on bending and compression behaviors. The comparison centers on the results of bending rigidity and energy absorption capacity, intending to be obtained from simulation and practical outcomes. The research addresses challenges related to achieving consistent mass across lattice structures due to manufacturing parameters. Discrepancies in flexural rigidity and compression behavior among the produced models trigger an exploration into the influence of design factors. The study reveals significant insights into the mechanical properties of six complex lattice structures produced through FDM 3D printing. The Tetrahedron-Cubic lattice stands out with superior bending rigidity at 15.36 N/mm, and variations in performance are attributed to layer orientation and material anisotropy. Specific energy absorption reaches its peak in the Tetrahedron-Cubic lattice at 38.54 J/g. These conclusive results provide considerations for future design and optimization. Through a focus on simplicity, intricacy, and unique geometry, the study effectively tackles manufacturing challenges and resolves discrepancies between experimental tests and simulations.
Keywords
Bending behavior, crush behavior, fused deposition modeling 3D printing, design optimization, lattice structures
Introduction
Lattice structures, characterized by repeating units arranged in a regular pattern and often interconnected by beams or struts, serve as a foundational element in materials science and engineering, offering lightweight construction, high specific strength, stiffness, and exceptional mechanical properties.1 This intersection of engineering ingenuity and natural inspiration, as a subset of cellular materials, provides numerous benefits across architectural, engineering, and industrial fields.2 These structures emulate the efficiency and strength of naturally occurring patterns found in materials like cork, sponge, and honeycombs, while engineered counterparts range from metal-based to polymer and composite materials, showcase practicality in various applications, notably in providing efficient yet robust solutions, ideal for aerospace,3 a utomotive,4 biomedical,5 and thermal applications6 where weight reduction and strengthto-weight ratio are paramount.
The evolution of additive manufacturing (AM) has profoundly impacted the fabrication of lattice structures, displacing traditional methods such as extrusion,7 casting,8 clinching,9 injection molding,10 compression molding, and thermoforming.12 AM, also known as 3D printing, has emerged as a key player in modern manufacturing, offering numerous advantages over conventional techniques. These include low production cost, high precision, and the ability to create complex designs.13 As outlined by ISO ASTM 52900-2021, additive manufacturing encompasses a variety of processes and principles that have been standardized to ensure consistency and quality in production.14 This transformation has been particularly pronounced in the creation of complex lattice geometries using materials like acrylonitrile–butadiene–styrene (ABS) and polyethylene terephthalate (PET).15 Among the diverse array of 3D printing technologies, FDM has emerged as the frontrunner, owing to its accessibility cost-effectiveness, and functionality. 16 Its versatility extends across scientific
School of Aeronautics, Northwestern Polytechnical University, Xi’an, China
Corresponding author:
Reza Shamim, School of Aeronautics, Northwestern Polytechnical University, 127 West Youyi Road, Beilin District, Xi’an Shaanxi 710072, China.
Email: r.shamim@nwpu.edu.cn
Data Availability Statement included at the end of the article development, rapid prototyping, and industrial manufacturing, revolutionizing the landscape of lattice structure fabrication and opening avenues for applications requiring high specific strength or energy absorption capability.1
Considering this, the orientation in which the lattice structure is printed and the direction in which it’s loaded greatly affect its mechanical properties. Lattice structures produced vertically or at a 45-degree angle exhibit strong anisotropy, with the properties depending heavily on the loading direction. In contrast, horizontally printed lattice structures tend to be more isotropic. This is because the fracture in vertically or angled lattices is caused by sliding and delamination between the layers, rather than fracture of the polymer itself.18 The cell shape and topology of the lattice structure also play a role. Lattice structures with hexagonal cells show good agreement between static threepoint bending tests and dynamic mechanical analysis results. Functionally graded lattice structures can also exhibit higher total cumulative energy absorption per unit volume compared to uniform lattice structures.19
Various lattice structures fabricated through 3D printing underwent bending tests to uncover their distinct properties. Gullapalli identified triangular and honeycomb shapes as having the highest flexural strength among the six lattice structures considered.20 The resistance of a face-centered cubic (FCC) lattice has been calculated using the lattice Green’s function method, with theoretical results verified experimentally.21 Blattmann22 introduced a testing methodology, determining that the Reinforced Body Centered Cubic (BCC) excelled in bending, the Octet Truss in compression, and the Octahedral performed poorly in both tests. Both Li23 and Ursini24 observed that lattice structures with varied designs and specific rigidities, along with a 6 × 6 × 6 diagonal shape, demonstrated superior mechanical performance and stiffness. Monkova25 warned against using lattice structures in bending-loaded components due to their limited stress-carrying capacity.
Exploring thermoplastic polyurethane-based lattice structures, Beloshenko focused on investigating the influence of build orientation and loading direction on the mechanical properties of 3D-printed thermoplastic polyurethane-based lattice structures, highlighting strong anisotropy, with horizontally printed specimens displaying nearly isotropic behavior, and emphasizing the superior performance of lattice structures with square cells printed horizontally, alongside the potential for significant strength enhancement using epoxy polymer fillers, supported by a developed mathematical model elucidating various failure mechanisms.26 Tiwari added programmed out-of-plane curvature to bending-dominated lattices to increase their specific stiffness.27 Khosravani investigated the in-plane behavior of lattice composites and demonstrated the stability of acrylonitrile styrene acrylate with a honeycomb core under bending load following thermal aging.28 Liu discovered that the stiffness of a BCC stretching-bending synergistic lattice material, a variation of the FCC, increases with the relative density of the frame unit cell.29 This implies that higher-density FCC lattice structures may also exhibit increased bending rigidity. Similarly, Liu30 and Zhou31 both showcased that 3D-printed lattice cores, including FCC-like and BCC-like topologies, enhance the flexural stiffness and strength of sandwich structures. These findings suggest that the bending rigidity of FCC polymer lattice structures can be influenced by their 3D-printed core design. Additionally, Salazar demonstrated that a polymeric lattice reinforcement, such as an FCC lattice, significantly improves the bending performance of concrete structures. This indicates that the bending rigidity of FCC polymer lattice structures may also be influenced by their application in composite materials.32 Rueger investigates nonclassical elastic size effects in a tetragonal lattice structure, particularly in relation to Cosserat elasticity.33 Huang presents an experimental study on the self-assembly of rigid giant tetrahedra, highlighting the potential for ordered structures in this field.34 These studies collectively underscore the potential for 3D printing to produce lattice structures with improved bending rigidity, as well as the necessity for careful design and testing to ensure their suitability for specific applications.
A variety of lattice structures have undergone compression studies, with different patterns demonstrating varying strengths and energy absorption capabilities. Park determined that lattice structures based on simple cubic, octahedron, truncated cube, and truncated octahedron with a 3 × 3 × 3 array pattern exhibit superior axial compressive strength properties. Additionally, Park et al. investigated the mechanical properties of metallic AM lattice structures, highlighting the BCC structure’s lower compressive yield load compared to simple cubic and FCC structures, particularly in relation to relative density.35 Umer states that the F2BCC lattice structure had the highest compression strength, but the BCCz lattice structure outperformed the others when normalized by relative density.36 Another study discovered the compression behavior of BCC polymeric lattice structures, finding that the UBCCz configuration showed superior stiffness and energy absorption due to its reinforced vertical strut.37 Kohnen compared two different lattice structures, f2cc,z and hollow spherical, finding that the f2cc,z lattice structures deformed by stretch, had higher energy absorption capacity, and were capable of bearing higher loads.38 Spear explored how lattice topology, cell size, cell density, and surface thickness affect mechanical properties, revealing their significant impact on performance.39 The high compression strength of sandwich structures reinforced with continuous carbon fiber was brought to light by Striemann.40 According to Li, as the number of layers in multi-layer lattice panels increases, so does their compressive modulus and initial crushing strength.41 Wu delved into the effects of selectively placed vertical support struts on lattice structure mechanics.42 There are reports discovered that lattice structures, especially those with tetrahedron-based designs, showed minimal stacking directional dependence, along with enhanced impact energy absorption and compression resistance.43 Sun introduced hybrid lattice structures that exhibited stable post-yield stress plateau and improved energy absorption.44 Neuhauserová analyzed the compressive deformation of re-entrant tetrakaidecahedral lattices, noting strain-rate sensitivity without auxetic behavior.45 Amani studied the compression behavior of selectively lasermelted hollow architectured structures, using X-ray tomography and finite element modeling to anticipate fracture locations.46 Qi and Ling both explored the mechanical properties of various lattice structures. Qi focused on octettruss and truncated octahedron lattices, while Ling examined polymeric octet-truss lattices. Both studies revealed that relative density and material properties significantly influence mechanical behavior.47,48 Lian compared a novel re-entrant honeycomb structure, composed of hexagonal and triangular lattices, analyzing its crushing behavior through finite element analysis, revealing varying effects of gradient parameters on in-plane and out-of-plane crushing, and highlighting the nuanced influence of substructure angles on platform stress and energy absorption.49
Notably, the simple square is the most efficient isotropic strut-based lattice topology for specific strength and stiffness and BCC lattice structure has been found to be an option for reducing anisotropic properties in AM processes. 50
The tetrahedron lattice structure exhibits different mechanical properties compared to other lattice topologies like BCC and pyramidal. Specifically, the TetH lattice structure has a higher Young’s modulus (143.679 MPa) and yield stress (5.13 MPa) compared to the BCC lattice, as shown by the experimental and finite element analysis results. The peak load for the tetrahedron lattice was also higher at 3372.12 N compared to the BCC lattice. The good correlation between the simulation results and the experimental data demonstrates the validity and accuracy of the modeling approach used to investigate the compressive behavior of these polymer lattice structures.51 Additionally, the search results indicate that the BCC lattice structure exhibits different mechanical properties compared to the U-BCC, U-BCCz, G-BCC, and G-BCCz lattice structures considered in this study, with quantitative analysis revealing notable variations in compressive behavior and energy absorption. Specifically, the U-BCCz lattice displayed a significant enhancement in vertical stiffness, achieving a Young’s modulus of 4 MPa, approximately 27 times higher than the traditional U-BCC lattice. This reinforcement led to superior compression resistance, highlighted by the U-BCCz lattice’s ability to withstand severe plastic deformation, as evidenced by a rapid stress increase at 60% strain. Such findings underscore the effectiveness of z-directional reinforcement in improving lattice structural integrity and mechanical performance.52 These studies collectively contribute to our understanding of the compressive behavior of additively manufactured lattice structures, with potential implications for material design and engineering applications.
This research aims to comprehensively investigate the mechanical response of FDM-manufactured polymer lattice configurations. This investigation examines the bending and crush behaviors of polymer lattice structures using six distinct lattice models: simple square lattice core, BCC, FCC, Combined (BCC-FCC), Diamond–Cubic, and Tetrahedron–Cubic lattice beam structures. The criteria for model selection include suitability for FDM, considering factors like simplicity, regular geometry, potential challenges of intricate structures, desired synergistic properties and high stiffness, and structural soundness within FDM constraints. Numerical simulations and mechanical tests, including 3-point bending and crush tests, are employed to evaluate the material’s structural integrity and mechanical properties. Additionally, SEM analysis illustrates the printability and surface morphology of the FDM-printed parts. The findings reveal that the load bearing capacity, bending rigidity, energy absorption, and specific energy capacities vary significantly across the different lattice models. This analysis addresses challenges in FDM 3D printed polymer lattice structures, such as achieving high precision in intricate lattice structures and evaluating the complexity of lattice designs with manufacturability constraints. It validates mechanical properties under various loads, creates accurate simulation models, and reconciles CAD ideals with practical manufacturing through SEM analysis to assess the mechanical performance of equal mass lattice systems with different structures.
Materials and methods
This observation investigates the bending behaviors of various lattice structures with different shapes under threepoint bending, where the specimens experience both tension and compression along their length, the parts are anchored at two ends, while a downward force is applied at its midpoint. This configuration restricts translational movement, inducing bending deformation and generating flexural stress and strain.
To establish a comparative baseline, we began by analyzing the beam properties. The moment of inertia (I) can be calculated using the formula
where a and b represent the width and height of the rectangular cross-section, respectively. Flexural rigidity (D) is a measure of a material’s ability to withstand bending, defined as
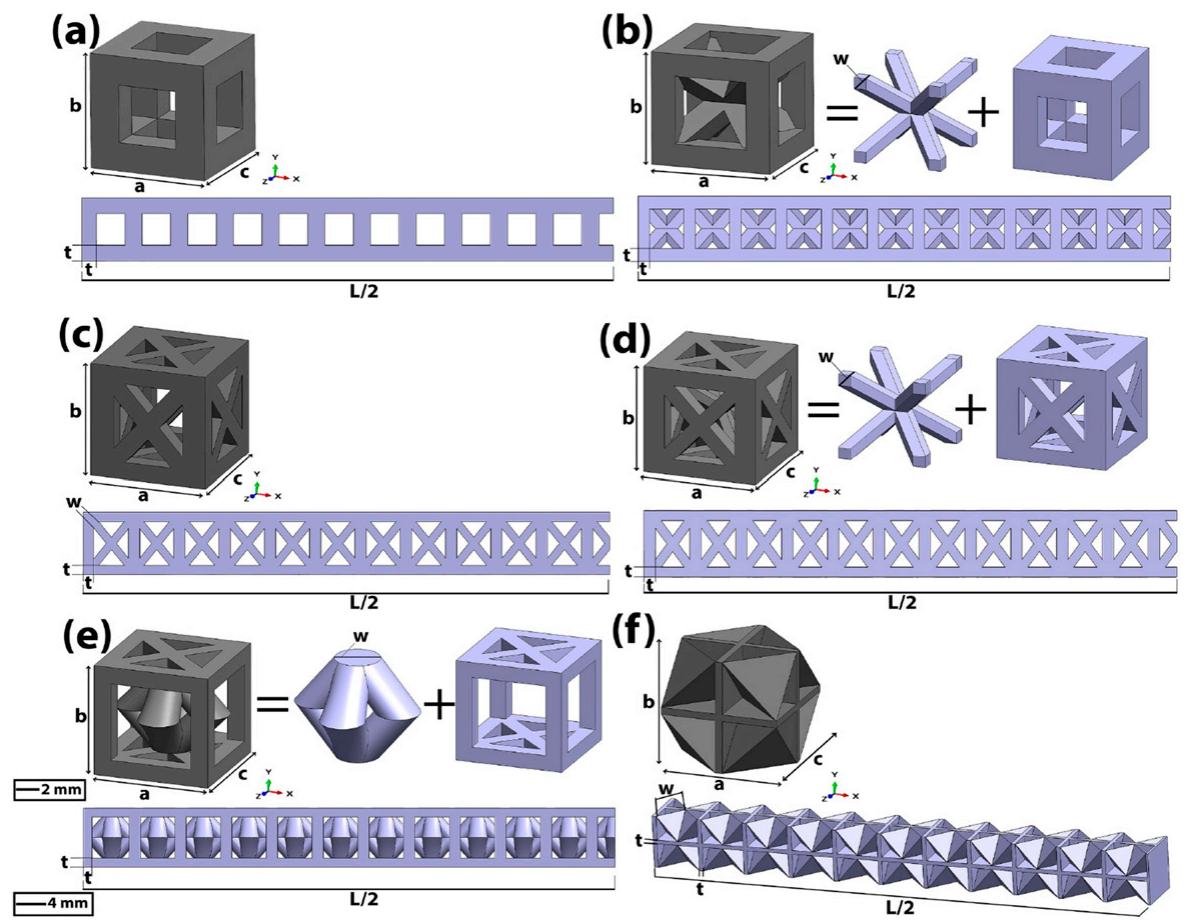
Figure 1. Lattice beams and their unit cells: (a) simple square, (b) BCC, (c) FCC (d), combined [BCC-FCC], (e) diamond-cubic, and (f) tetrahedron-cubic beams. BCC: body centered cubic; FCC: face-centered cubic.
where E denotes the modulus of elasticity.
The maximum deflection subjected to a bending load can be determined by
Setting the shear term to 0 establishes U as the structural shear rigidity
Sigma is the material’s tensile strength, while F stands for the applied force, and L signifies the length of the beam.
Lattice design
To bridge the analysis of solid rectangular cross-sections with the lattice structures, we turn our attention to the design considerations. This approach was intentionally designed to support a direct evaluation based on distinct core forms. Six models are designed in a CAD program as shown in Figure 1.
Table 1. Design geometry parameters of the models.
| Model | a, b, c (mm) | t (mm) | w (mm) |
| Simple square | 7.4 | 2 | - |
| BCC | 7.4 | 1.4 | 1.2 |
| FCC | 7.4 | 1.2 | 1 |
| Combined | 7.4 | 1.1 | 0.93 |
| Diamond-Cubic | 7.4 | 0.9 | 2.12 |
| Tetrahedron-Cubic | 7.4 | 0.69 | 5.49 |
BCC: body centered cubic; FCC: face-centered cubic.
The selected models were chosen based on factors such as i. Well-suited for FDM due to its simplicity and regular geometry (simple square, and FCC) ii. Can be challenging due to its intricate geometry, especially without proper support structures (BCC, and Combined). iii. For synergistic properties and high stiffness (Diamond-Cubic) iv. Tetrahedron-Cubic for its unique geometry can be structurally sound if designed with FDM constraints in mind. The lattice structures differ in geometry and shape while sharing similarities such as equal length, width, mass, and material properties (Table 1). The width (a), length (b), and thickness (c) of each unit were 7.4 mm, and each beam consisted of 23 cells.
natural_image
Experimental setup with a metal clamp and ruler, alongside a grid of white plastic components (no visible text or symbols)
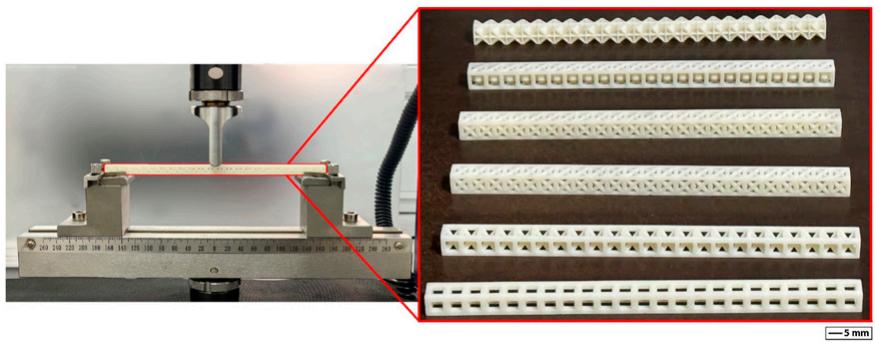
Figure 2. Boundary condition of 3-point bending test and 3D-printed beams.
Table 2. Mechanical properties of acrylonitrile–butadiene– styrene plus.
| Tensile | Compressive | |
| Ultimate strength (MPa) | 33 | 42 |
| Yield strength (MPa) | 31 | 37 |
| Elongation at yield (%) | 2 | - |
| Modulus of elasticity (GPa) | 2.2 | 1.80 |
| Poisson's ratio | 0.36 | 0.36 |
| Density $(kg/m^3)$ | 1020 | 1020 |
Production of lattice structures
ABS Plus was selected for this study due to several key factors. First, it offers favorable mechanical properties, including strength, durability, and impact resistance, which are essential for load-bearing applications. Additionally, it is known for its ease of printing, particularly using FDM (Fused Deposition Modeling) technology, due to its good layer adhesion and ability to produce intricate geometries. Moreover, this material is widely available and costeffective, making it a practical choice for both research and industrial applications.53 The models are manufactured by Stratasys FDM and the layer thickness is 0.254 mm with the standard sparse high-density fill patterns from Stratasys, where the fully dense solid structure is created by using the linear scan pattern. The default temperature settings used for the model material were as follows. It was maintained that the printer head temperature was and the chamber temperature was . Certain samples needed support materials, and the complexity of the geometry determines how much was needed. For instance, no support material was needed for the struts of the simple square and BCC specimens—only at the bottom. After immersing the samples in the heated chemical bath for about 8 h, a Stratasys cleaning apparatus was used to remove the support material. The removal of the support structure is sped up by the tank’s heating and circulation of water. The specimens underwent a room-temperature water wash and drying after the material was removed. The images make it evident that, despite the printed layers being easily visible, there is no discontinuity between them. However, several challenges were faced during the removal of support materials and post-processing. Ensuring the complete removal of support material, particularly in the intricate geometries of the lattice structures, was a primary challenge. This was addressed by immersing the specimens in a heated chemical bath for about 8 h, with the heated bath and water circulation facilitating thorough cleaning. Maintaining structural integrity during post-processing was another challenge, tackled by carefully controlling the bath temperature and immersion duration to prevent warping or damage. Additionally, avoiding discontinuities and layer separation was crucial for mechanical performance, achieved by optimizing the removal process to ensure even cleaning without affecting layer bonding. The SEM analysis confirmed the absence of discontinuities despite the visibility of printed layers. Time efficiency was also a concern, especially in the Combined (BCC-FCC) and Diamond-Cubic cases, where complex geometries required more time-consuming cleaning. This issue was mitigated by using the Stratasys cleaning apparatus to significantly speed up the process. These steps ensured the production of high-quality, structurally sound lattice structures, critical for reliable and reproducible mechanical testing and analysis. The most significant structural characteristic of a lattice pattern is the relative density, where and are the densities of the lattice and solid materials, respectively.54 This means that the average infill density used is approximately 44% of the solid density.
3-point bending test
Experimental setup. A universal testing machine (Figure 2) is performed to do the experimental tests it’s notable that the maximum load capacity is 30 KN, and in the 3-point bending test, specimens are anchored by two fixed supports, preventing translation and rotation. A concentrated force is applied at a midpoint between these supports, inducing bending. The setup ensures symmetry for simplified analysis and the spin applies 0.5 mm/min load over the samples. The standards of the tested specimens, including relevant references, have been thoroughly reviewed and addressed in this study.55
Finite element analysis. In conducting the finite element analysis (FEA) of the lattice structures using Abaqus, several assumptions were made to facilitate the simulation process. The lattice structure CAD models were anchored by two fixed supports, preventing translation and rotation. This setup ensured symmetry for simplified analysis, with the span between the supporter and midpoint set at 66.5 mm. Additionally, the applied point load was transferred to the middle of the beam span under quasi-static conditions, with a controlled displacement velocity of 0.5 mm/min. Surfaceto-surface contact interaction was established between the rigid bodies and the beam, and the material properties utilized in the simulation aligned with ABS Plus for effective comparison with experimental tests as specified in Table 2.56
The C3D10 element in Abaqus, a 10-node quadratic tetrahedron, is employed for accurate modeling of complex deformations in solid designs. It utilizes quadratic interpolation functions to represent intricate shapes and capture linear deformations in structural simulations. Table 3 lists the number of elements for each model.
Symmetric conditions were applied in the simulation due to the system’s inherent symmetry, ensuring that behavior was consistent across the central axis.
Crush test
Experimental setup. Here the cubic block specimens were chosen for the crush test due to their ability to evenly distribute compressive forces, ensuring a representative evaluation of the material’s response to axial loading. This geometry simplifies the analysis of energy absorption and deformation behavior, enabling accurate measurement of parameters like peak force and crushing strength. The “as
Table 3. Number of elements for each case study.
| Beam model | Simple square beam | BCC beam | FCC beam | Combined [BCC-FCC] beam | Diamond-Cubic beam | Tetrahedron-Cubic beam |
| Element numbers | 14539 | 14918 | 14189 | 15309 | 17397 | 14710 |
BCC: body centered cubic; FCC: face-centered cubic.
natural_image
Mechanical testing setup showing a 3D-printed white plastic structure being processed with a metal workpiece, alongside its three-dimensional grid-based structures (no text or symbols visible)
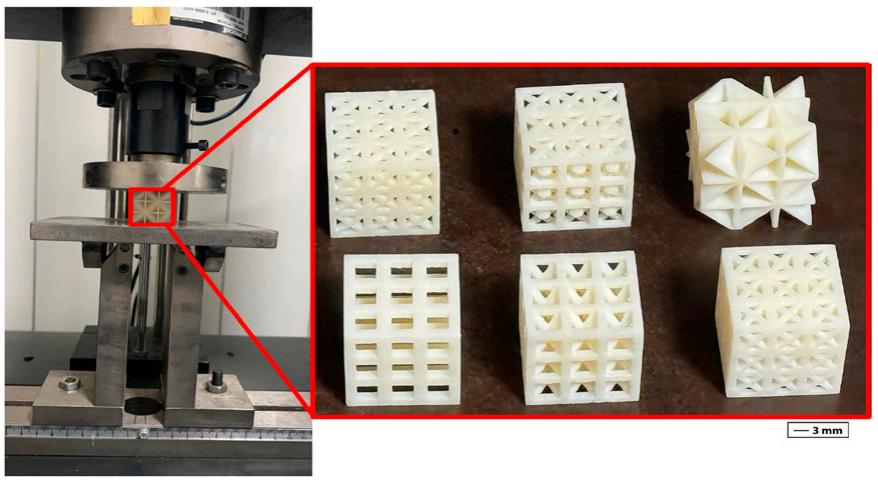
Figure 3. Boundary condition of the crush test and 3D-printed blocks.
Table 4. Number of elements for each case study.
| Block model | Simple square | BCC | FCC | Combined [BCC-FCC] | Diamond-Cubic | Tetrahedron-Cubic |
| Element numbers | 20084 | 22034 | 22211 | 23536 | 35082 | 20047 |
BCC: body centered cubic; FCC: face-centered cubic.
natural_image
3D-printed white cube structure with visible internal grid pattern, labeled (a) and a red arrow pointing to its edge.
natural_image
Microscopic surface texture image showing granular and fibrous structures (no text or symbols visible)
natural_image
3D-printed white lattice structure with a red square highlighting a specific cell (no text or symbols)
natural_image
Microscopic surface texture image showing layered patterns and cracks (no text or symbols)
natural_image
3D-printed white cube with intricate lattice structure, labeled (c), with a red arrow pointing to its edge (no text or symbols on the cube itself)
natural_image
Microscopic surface texture with a central X-shaped defect (no text or symbols visible)
natural_image
3D-printed white cube with intricate grid pattern, labeled (d) in corner (no text or symbols on the cube itself)
natural_image
Microscopic surface images showing layered structures and texture (no text or symbols)
natural_image
3D-printed white cube structure with textured surface and red annotation highlights (no text or symbols)
natural_image
3D-printed white geometric crystal structure with a red square highlighting a specific surface (no text or symbols)
-3mm
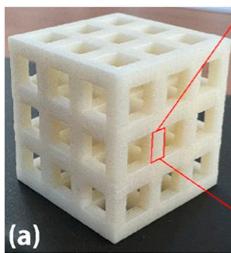
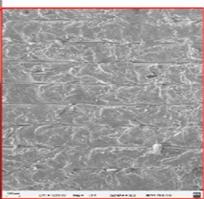
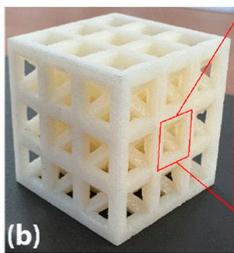
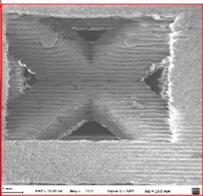
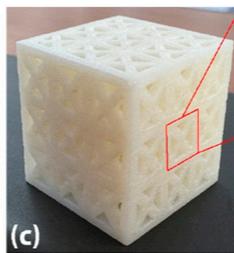
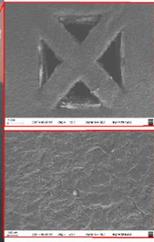
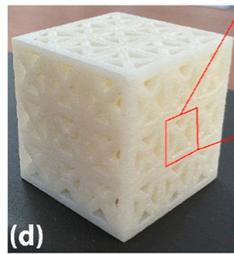
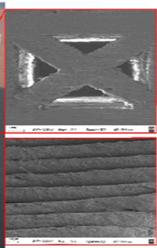
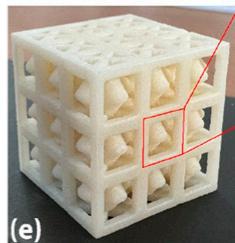
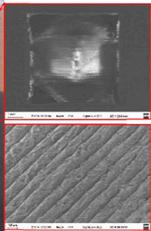
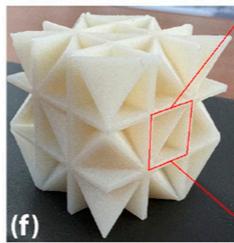
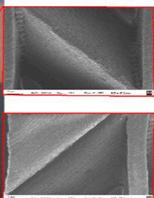
Figure 4. SEM observed the surface morphology of the FDM-printed BCC specimen: (a) simple square, (b) BCC, (c) FCC, (d) combined, (e) diamond-cubic, and (f) tetrahedron-cubic. BCC: body centered cubic; FCC: face-centered cubic; FDM: fused deposition modeling.
Table 5. The corresponding mass of each beam.
| Models | As designed (grams) | As manufactured (grams) | Infill density (%) |
| Simple square | 6.38 | 6.42 | 44 |
| BCC | 6.38 | 6.44 | 44 |
| FCC | 6.38 | 6.42 | 44 |
| Combined [BCC-FCC] | 6.38 | 6.51 | 44 |
| Diamond-Cubic | 6.38 | 6.48 | 44 |
| Tetrahedron-Cubic | 6.38 | 6.40 | 44 |
BCC: body centered cubic; FCC: face-centered cubic.
Table 6. The corresponding mass of each block.
| Models | As designed (grams) | As manufactured (grams) | Infill density (%) |
| Simple square | 5.27 | 5.31 | 46 |
| BCC | 5.27 | 5.37 | 46 |
| FCC | 5.27 | 5.42 | 46 |
| Combined [BCC-FCC] | 5.27 | 5.60 | 46 |
| Diamond-Cubic | 5.27 | 5.40 | 46 |
| Tetrahedron-Cubic | 5.27 | 5.35 | 46 |
BCC: body centered cubic; FCC: face-centered cubic.
designed” mass represents the theoretical weights calculated within the CAD program, reflecting the intended specifications. In accordance with ASTM D1621,57 we conducted crush tests on six lattice structures using Instron 5500 R, a universal testing machine that has a maximum load capacity of 150 KN. The 3 × 3 specimens, each with dimensions of 22.2 mm in height, width, and length, were fixed from the bottom and subjected to controlled lowvelocity impact at 0.5 mm/min. This approach allowed us to assess the structures’ relative performance by observing their behavior until failure, providing valuable insights into their mechanical characteristics. The configurations are depicted in Figure 3. The specimens had a 60% reduction in height due to compression.
Finite element analysis. Using Abaqus, we simulated the experimental conditions of block models matching the specimens. Employing quadratic tetrahedral elements (C3D10 M) and ABS Plus material properties, as detailed in Table 1, the top of the body was given free axial movement of 0.5 mm/min, whereas the bottom had all degrees of freedom set to zero. The bottom surface is assumed to be rigid, establishing contact with the bottom of the lattice. The simulation aimed to replicate the experimental outcomes, providing a numerical perspective on the lattice structures’ mechanical response to compressive loads. Numerical simulations are significant in saving both time and cost by reducing the need for extensive physical prototyping and testing.58 The number of elements in each case study has been listed in Table 4. Force-displacement and stress distribution outcomes have been obtained at 20%, 40%, and 60% strain from the initial height.
heatmap
| Panel | Value Range |
|---|---|
| (a) | 33.00–30.25 |
| (a) | 27.50–24.75 |
| (a) | 22.00–19.25 |
| (a) | 16.50–13.75 |
| (a) | 11.00–8.25 |
| (a) | 5.50–2.75 |
| (a) | 0.00–0.00 |
| (b) | 33.00–30.25 |
| (b) | 27.50–24.75 |
| (b) | 22.00–19.25 |
| (b) | 16.50–13.75 |
| (b) | 11.00–8.25 |
| (b) | 5.50–2.75 |
| (b) | 0.00–0.00 |
| (c) | 33.00–30.25 |
| (c) | 27.50–24.75 |
| (c) | 22.00–19.25 |
| (c) | 16.50–13.75 |
| (c) | 11.00–8.25 |
| (c) | 5.50–2.75 |
| (c) | 0.00–0.00 |
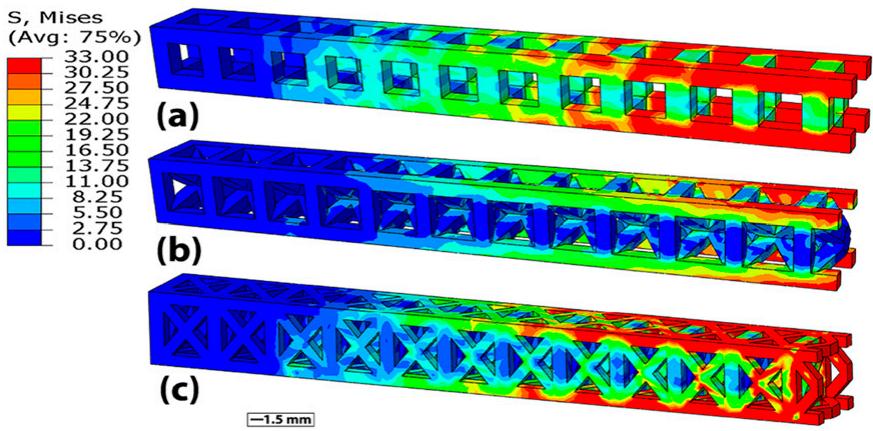
Figure 5. Von Mises stress analysis in lattice structures: (a) simple square, (b) body centered cubic, and (c) face-centered cubic.
text_image
PEEQ (Avg: 75%) 0.123 0.062 0.000 (a) PEEQ (Avg: 75%) 0.131 0.066 0.000 (b) PEEQ (Avg: 75%) 0.061 0.031 0.000 (c) -1.5 mm
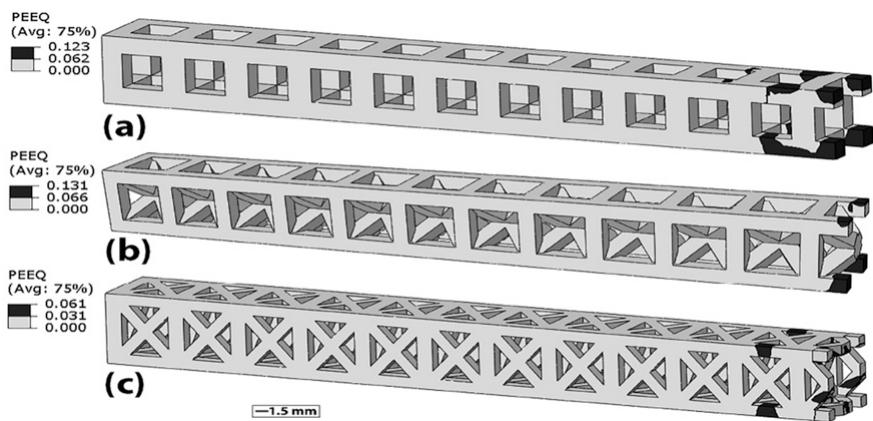
Figure 6. Visualization of plastic deformation on models: (a) simple square, (b) body centered cubic, and (c) face-centered cubic.
Results and discussion
Manufacturability
Image captured using the Hitachi S4800 SEM device showcasing the surface morphology and microstructure of the lattice 3D printed parts (Figure 4). The SEM image provides detailed insights into the structural characteristics, surface topology, and material composition at a microscopic level.
In Table 5 as-designed and as-manufacturing mass of each model has been mentioned, the main difference between them is because of removing supports (postprocessing) which can lead to slight variations or imperfections in the final product compared to the original design.
Conversely, the “as manufactured” mass indicates the actual weights of the 3D printed models (Table 6).
Bending rigidity
Following the application of load to each model, Von Mises stress distributions for the lattice structures were observed. Critical regions inside the part can be identified by looking at the maximum Von Mises stress distribution with a 30N load. Notably, all three models reached the ultimate point, undergoing plastic deformation. In Figure 5, the Von Mises stress distribution maps vividly depict these variations. In cases (a) and (c), the stress was uniformly distributed along the entire beam, whereas in case (b), stress concentrations were observed at the top and bottom regions.
heatmap
| Panel | Avg S, Mises |
|---|---|
| (d) | 29.69 |
| (d) | 29.00 |
| (d) | 26.58 |
| (d) | 24.17 |
| (d) | 21.75 |
| (d) | 19.33 |
| (d) | 16.92 |
| (d) | 14.50 |
| (d) | 13.08 |
| (d) | 9.67 |
| (d) | 7.25 |
| (d) | 4.83 |
| (d) | 2.42 |
| (d) | 0.00 |
| (e) | 27.88 |
| (e) | 25.56 |
| (e) | 23.23 |
| (e) | 20.91 |
| (e) | 18.59 |
| (e) | 16.26 |
| (e) | 13.94 |
| (e) | 11.62 |
| (e) | 9.29 |
| (e) | 6.97 |
| (e) | 4.65 |
| (e) | 2.32 |
| (e) | 0.00 |
| (f) | 25.12 |
| (f) | 23.03 |
| (f) | 20.93 |
| (f) | 18.84 |
| (f) | 16.75 |
| (f) | 14.65 |
| (f) | 12.56 |
| (f) | 10.47 |
| (f) | 8.37 |
| (f) | 6.28 |
| (f) | 4.19 |
| (f) | 2.09 |
| (f) | 0.00 |
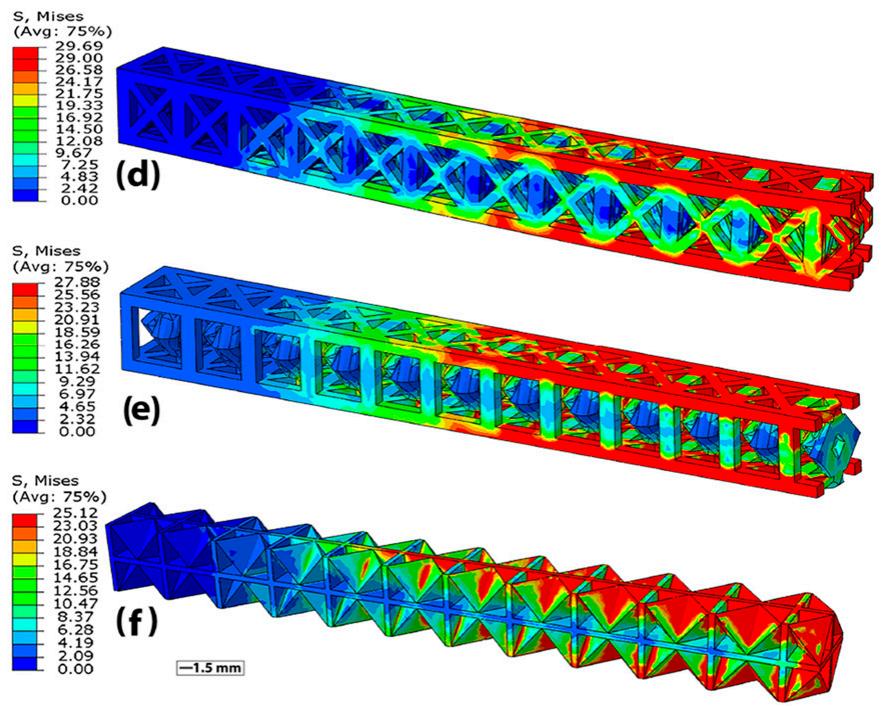
Figure 7. Von Mises stress distribution on optimized structures: (d) Combined, (e) Diamond-Cubic, and (f) Tetrahedron-Cubic.
Additionally, in Figure 6, the visualization of plastic deformation on the lattice models further illustrates the effects of the applied load. This visual representation enhances our understanding of how the lattice structures respond under significant stress, particularly in areas of concentrated deformation. Below, it is evident that the load required for plastic deformation in the FCC beam is significantly lower compared to the other two cases. Conversely, the plastic zone in the BCC structure is noticeably smaller than in the simple square structure, indicating a higher concentration of stress.
The stress distribution for the next three models under the 3-point bending test is shown in Figure 7.
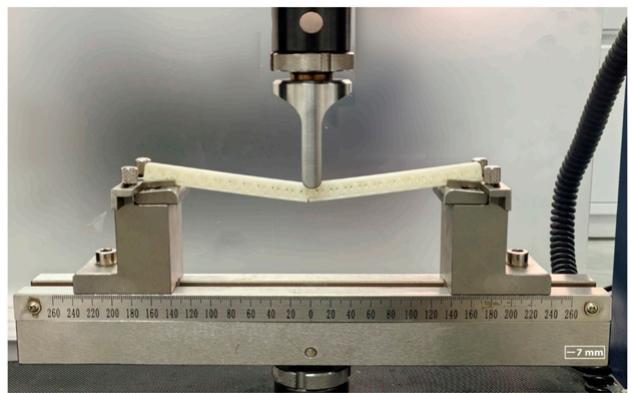
In Figure 8, the structural response and damage incurred by the combined [BCC-FCC] beam type subjected to a 3- point bending test are visually depicted, illustrating deformation and failure characteristics under applied load.
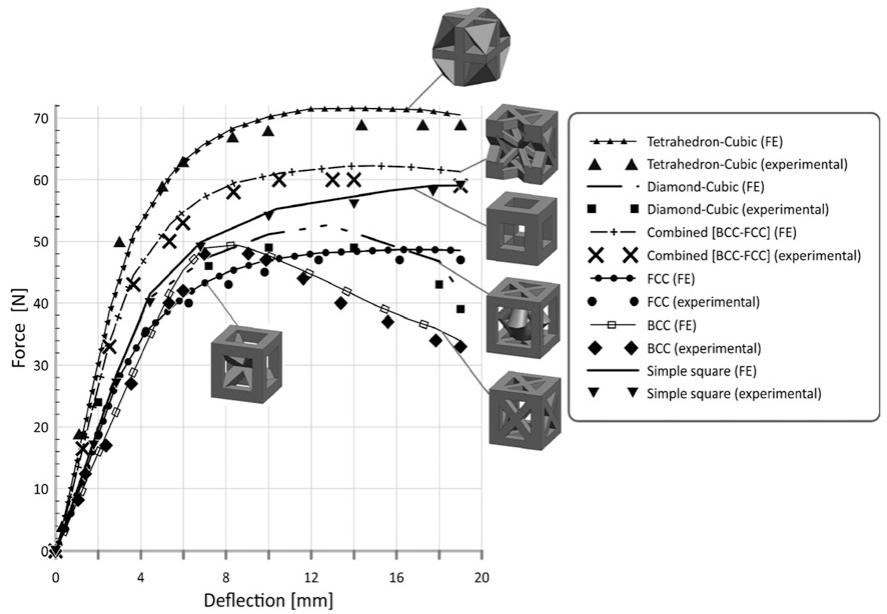
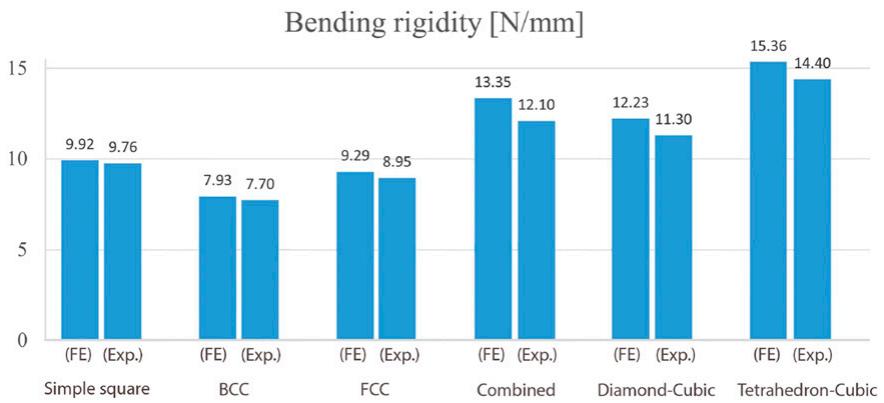
The force–displacement curve for the six case studies is shown in Figure 9 and illustrates the link between the gradually rising applied load and the associated maximum deflection. A higher flexural stiffness was found to correlate with a higher maximum load-carrying capacity and less deflection through the investigation of the bending rigidity in each case study.
The FCC type exhibits the lowest deflection, deforming by 2.014 mm at a load of 18.716 N. The simple square type deforms by 2.85 mm at 28.298 N, while the BCC type bends by 3.54 mm under a load of 28.11 N. A 30.56 N load is applied to the Diamond-Cubic core lattice, resulting in a 2.5 mm beam deformation. The Combined [BCC-FCC]
natural_image
Laboratory setup with a metal testing apparatus and a vertical ruler, no visible text or symbols on the apparatus itself.
Figure 8. The damaged beam under 3-point bending test.
type experiences a 2.525 mm deflection under a 33.73 N load. Lastly, the Tetrahedron-Cubic type, being the stiffest, deforms by 2.52 mm under a 38.79 N load. In this comparative analysis, we investigate the bending rigidity of the distinct models (Figure 10). By scrutinizing the forcedisplacement curves, we meticulously extract the slope of the linear segment, an essential parameter for assessing bending rigidity.
Crush behavior
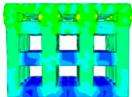
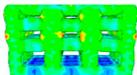
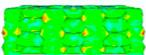
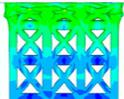
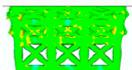
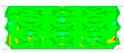
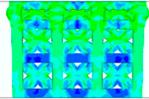
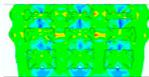
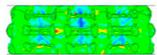
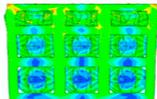
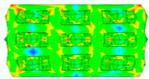
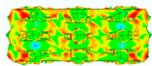
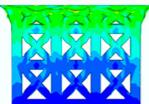
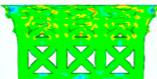
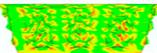
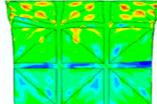
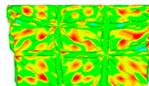
To compare simulation results, stress distribution analyses were performed on each structure (Figure 11). For the simple square lattice, stress predominantly accumulates at the corners, leading to failure at these points. In the BCC lattice, stress concentrates at the center of cube faces and edges, representing the primary failure zones. Similarly, the FCC lattice exhibits stress concentration at the center of cube faces, albeit with potential variations in failure patterns compared to BCC. The combined BCC-FCC lattice displays a combination of stress distributions, resulting in unique failure zones at the central points of faces and edges. In the Diamond-Cubic lattice, stress tends to concentrate at specific points on the diamond structure, likely at the tetrahedral corners, leading to failure in these regions. Finally, the Tetrahedron-Cubic lattice experiences stress concentration at the vertices where the tetrahedra meet, signifying the primary failure zones. The validation of the Finite Element Analysis (FEA) was achieved by comparing simulation outcomes with experimental data. During the experiments, displacement and corresponding force were recorded with high precision, considering video extensometer accuracy, force measurement precision, and initial length measurement uncertainty using digital micrometers. Tests were conducted in both elastic and plastic regimes, but only elastic characteristics were considered for this study. The force–displacement curves, stress distribution, and deformation patterns from the FEA were matched with experimental results, ensuring realistic assumptions and boundary conditions.
line
| Deflection [mm] | Tetrahedron-Cubic (FE) | Tetrahedron-Cubic (experimental) | Diamond-Cubic (FE) | Diamond-Cubic (experimental) | Combined [BCC-FCC] (FE) | Combined [BCC-FCC] (experimental) | FCC (FE) | FCC (experimental) | BCC (FE) | BCC (experimental) | Simple square (FE) | Simple square (experimental) |
|---|---|---|---|---|---|---|---|---|---|---|---|---|
| 0 | 0 | 0 | 0 | 0 | 0 | 0 | 0 | 0 | 0 | 0 | 0 | 0 |
| 2 | ~15 | ~18 | ~12 | ~14 | ~16 | ~17 | ~14 | ~13 | ~12 | ~11 | ~15 | ~16 |
| 4 | ~30 | ~35 | ~25 | ~28 | ~32 | ~34 | ~28 | ~26 | ~24 | ~22 | ~30 | ~33 |
| 6 | ~45 | ~50 | ~40 | ~43 | ~48 | ~50 | ~42 | ~40 | ~38 | ~36 | ~45 | ~48 |
| 8 | ~55 | ~60 | ~50 | ~53 | ~58 | ~60 | ~48 | ~46 | ~44 | ~42 | ~55 | ~58 |
| 10 | ~60 | ~65 | ~55 | ~58 | ~62 | ~64 | ~50 | ~48 | ~46 | ~44 | ~60 | ~63 |
| 12 | ~65 | ~70 | ~60 | ~63 | ~65 | ~67 | ~48 | ~46 | ~44 | ~42 | ~65 | ~68 |
| 14 | ~68 | ~72 | ~62 | ~65 | ~67 | ~69 | ~47 | ~45 | ~43 | ~41 | ~68 | ~71 |
| 16 | ~70 | ~73 | ~63 | ~66 | ~68 | ~70 | ~46 | ~44 | ~42 | ~40 | ~70 | ~73 |
| 18 | ~70 | ~73 | ~62 | ~65 | ~67 | ~70 | ~45 | ~43 | ~41 | ~39 | ~70 | ~72 |
| 20 | - | - | - | - | - | - | - | - | - | - | - | - |
| The chart displays a force (N) on the Y-axis against deflection (mm) on the X-axis. The legend distinguishes between FE and experimental data series for each method. The diagram includes multiple 3D cube models labeled with symbols and annotations. The data is presented in a single column format with labels ‘Fe’ and ‘Experimental’, but no trend or correlation is present due to the absence of data points. |
Figure 9. Force–displacement curves for lattice models under three-point bending conditions.
bar
Bending rigidity [N/mm]
| Category | FE (N/mm) | Exp. (N/mm) |
|---|---|---|
| Simple square | 9.92 | 9.76 |
| BCC | 7.93 | 7.70 |
| FCC | 9.29 | 8.95 |
| Combined | 13.35 | 12.10 |
| Diamond-Cubic | 12.23 | 11.30 |
| Tetrahedron-Cubic | 15.36 | 14.40 |
Figure 10. Comparison of bending rigidity among 6 lattice models.
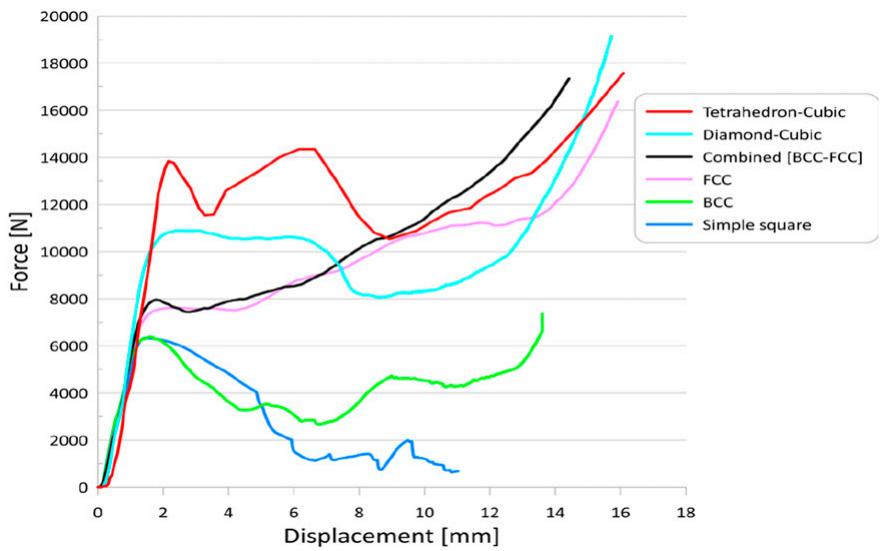
The force–displacement curves for each unit are shown in Figure 12. The stiffness order of models, from lowest to highest, is as follows: BCC, Diamond-Cubic, Cubic, FCC, Combined [BCC-FCC], and Tetrahedron-Cubic. The figure displays the force–displacement curves showcasing the failure behavior of Tetrahedron-Cubic lattice structures under crush testing. The punch has been applied to 14.25 mm. The range of figures visually depicts how these unit cells respond to applied forces concerning displacement, offering insights into their mechanical integrity and failure modes when subjected to crushing loads.
| ε=20% | ε=40% | ε=60% | ε=20% | ε=40% | ε=60% | ||
| Simple squareS, Mises(Avg: 75%) |  |  |  | Combined [BCC-FCC]S, Mises(Avg: 75%) | 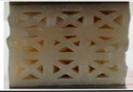 | 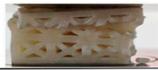 | 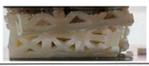 |
 |  |  |  |  |  | ||
| BCCS, Mises(Avg: 75%) | 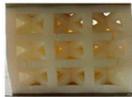 | 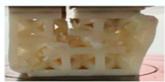 | 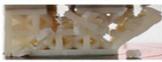 | Diamond-CubicS, Mises(Avg: 75%) | 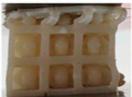 | 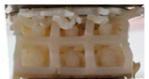 | 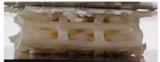 |
 |  |  |  |  |  | ||
| FCCS, Mises(Avg: 75%) | 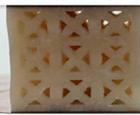 | 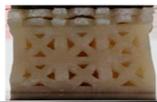 | 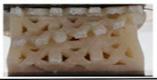 | Tetrahedron-CubicS, Mises(Avg: 75%) | 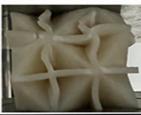 | 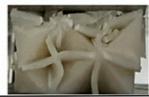 | 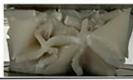 |
 |  |  |  |  |  |
-5mm
Figure 11. Visualization of Von Mises stress in lattice cells.
line
| Displacement [mm] | Tetrahedron-Cubic | Diamond-Cubic | Combined [BCC-FCC] | FCC | BCC | Simple square |
|---|---|---|---|---|---|---|
| 0 | 0 | 0 | 0 | 0 | 0 | 0 |
| 2 | 14000 | 11000 | 8000 | 7500 | 6500 | 6000 |
| 4 | 13000 | 10500 | 8500 | 7800 | 3500 | 4500 |
| 6 | 14500 | 10500 | 9000 | 8500 | 3000 | 2500 |
| 8 | 11000 | 8500 | 10000 | 9500 | 4500 | 1500 |
| 10 | 12500 | 9500 | 11500 | 11000 | 4500 | 2000 |
| 12 | 13500 | 11500 | 13500 | 11500 | 5500 | 1500 |
| 14 | 15500 | 14500 | 16500 | 13500 | 7500 | 150 |
| 16 | 17500 | 19500 | 19500 | 16500 | 7500 | 15 |
Figure 12. Force–displacement curves for lattice models under crush conditions.
Table 7 presents the comparison of compressive strength and compression elastic modulus of six lattice models. Compressive strength refers to the maximum stress a material can withstand under compression before failure, while compression elastic modulus measures the material’s stiffness under compression, representing the ratio of stress to strain within the elastic deformation range.
The energy absorption capacity is determined by the area under each curve. Based on evaluations, in Figure 13, it is evident that the Tetrahedron-Cubic model exhibits higher
energy absorption, indicating its greater ability to discharge and absorb energy under diverse stress circumstances. In contrast, the BCC type demonstrates the lowest absorption capacity. Besides, the diagram presented illustrates the specific energy absorption capabilities of six distinct lattice structures.
- The Tetrahedron-Cubic structure has higher energy absorption compared to the Diamond-Cubic structure due to its more interconnected network, which allows for better load distribution, more efficient stress transfer, and a combination of bending and stretching deformation mechanisms.
Table 7. Comparing compressive strength and elastic modulus of six lattice models.
| Models | Compressive strength (MPa) | Compression elastic modulus (MPa) |
| Simple square | 11.16 | 237.0712 |
| BCC | 12.96 | 254.2136 |
| FCC | 14.8 | 308.8202 |
| Combined | 15.44 | 317.2426 |
| Diamond-Cubic | 17.4 | 413.6720 |
| Tetrahedron-Cubic | 21.96 | 454.2 |
BCC: body centered cubic; FCC: face-centered cubic.
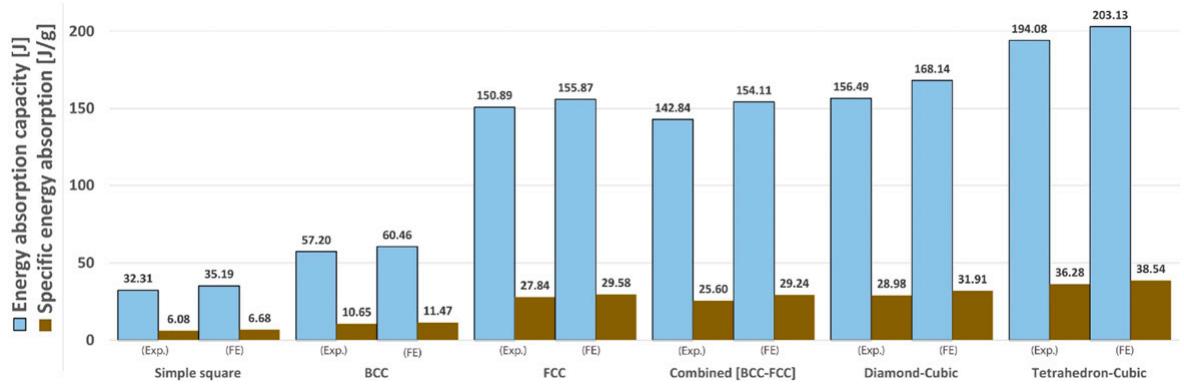
Figure 13. Comparison of energy absorption and specific energy capacities.
- The Diamond-Cubic structure absorbs more energy than the FCC structure due to its triangular connectivity, where each node is connected to four others that efficiently distribute loads, allowing for greater strain and more gradual failure. The inherent stability of these triangles ensures effective stress distribution and higher energy absorption.
- FCC demonstrates higher energy absorption capacity compared to the combined model, owing to the thinner design of the vertices in the combined model, ensuring uniform mass distribution.
- BCC exhibits superior energy absorption to simple cubic due to its diagonally oriented struts in multiple directions, enhancing energy absorption. Simple cubic, on the other hand, demonstrates poor energy absorption characterized by stress concentration at nodes and limited load paths, confined to horizontal and vertical orientations.
Conclusions
In this comprehensive work, we investigated the complex mechanical behavior of the six polymer lattice variants, revealing their comparable mechanical performance despite identical densities. Utilizing simulations and empirical tests provides valuable insights for optimizing these structures as impact-resistant materials and robust components in diverse applications. The key conclusions are as follows:
· ABS plus printability characteristics ensure the fabrication of lattice structures with high-quality surface morphology, which, coupled with the investigation of various intricate lattice structures’ 3D printability and analysis for discontinuities between layers, reveals excellent product quality, as confirmed by SEM analysis.
· The study investigated the feasibility of using FDM 3D printing for manufacturing a variety of lattice structures. Diverse lattice models were explored, including simple ones like square and FCC for printability, complex ones like BCC and combined to assess support structure impact, diamond-cubic for specific properties, and tetrahedron-cubic for unique geometry while considering FDM limitations. Despite efforts to achieve uniform mass, a variation of approximately 2.03% was observed among the lattice beams in the combined model, highlighting the substantial impact of manufacturing parameters and support structures on the final product.
· Analysis of bending rigidity revealed distinctive performance characteristics among the lattice structures. The Tetrahedron-Cubic lattice exhibited the highest bending rigidity at 15.36 N/mm, showcasing its potential for applications demanding superior stiffness. In contrast, the simple square lattice demonstrated the lowest bending rigidity at 7.7 N/mm. Discrepancies between
experimental tests and finite element simulations, ranging from 1.64% for the simple square lattice to 10.33% for the Combined [BCC-FCC] lattice, can be attributed to the anisotropic behavior of the material.
· The investigation into specific energy absorption highlighted significant differences among the lattice structures. The Tetrahedron-Cubic lattice excelled with a specific energy absorption of 38.54 J/g, while the simple square lattice exhibited the lowest at 6.08 J/g. Discrepancies between experimental tests and finite element simulations, ranging from -6.24% for the simple square lattice to 14.24% for the Combined [BCC-FCC] lattice.
The experimental and computational results demonstrate that, in comparison to other popular lattice topologies, the tetrahedron-Cubic model demonstrates superior compressive strength and stiffness.
Author contributions
Reza Shamim: investigation; methodology; data curation; writing original draft; conceptualization; formal analysis, resources.
Declaration of conflicting interests
The author(s) declared no potential conflicts of interest with respect to the research, authorship, and/or publication of this article.
Funding
The author(s) received no financial support for the research, authorship, and/or publication of this article.
ORCID iD
Reza Shamim https://orcid.org/0000-0002-4553-4968
Data availability statement
The data that support the findings of this study are available from the corresponding author upon request.
References
- Egan PF, Khatri NR, Parab MA, et al. Mechanics of 3D-printed polymer lattices with varied design and processing strategies. Polymers 2022; 14: 5515. DOI: 10.3390/polym14245515.
- Andrzejewski J, Gronikowski M and Anisko J. A novel manufacturing concept of LCP fiber-reinforced GPET-Based sandwich structures with an FDM 3D-Printed core. Materials 2022; 15: 5405. DOI: 10.3390/ma15155405.
- Zhu L, Li N and Childs P. Light-weighting in aerospace component and system design. Propulsion and Power Research 2018; 7: 103–119. DOI: 10.1016/j.jppr.2018.04.001.
- Czerwinski F. Current trends in automotive lightweighting strategies and materials. Materials 2021; 14: 6631. DOI: 10. 3390/ma14216631.
- Zhang Z, Mu Z, Wang Y, et al. Lightweight structural biomaterials with excellent mechanical performance:
a review. Biomimetics 2023; 8: 153. DOI: 10.3390/ biomimetics8020153.
6. Nagesha B, Dhinakaran V, Varsha Shree M, et al. Review on characterization and impacts of the lattice structure in additive manufacturing. Mater Today Proc 2020; 21: 916–919. DOI: 10.1016/j.matpr.2019.08.158.
7. Hyvarinen M, Jabeen R and Kärki T. The modelling of extrusion processes for polymers—a review. Polymers 2020; 12: 1306. DOI: 10.3390/polym12061306.
8. Richard CT and Kwok T-H. Analysis and design of lattice structures for rapid-investment casting. Materials 2021; 14: 4867. DOI: 10.3390/ma14174867.
9. Xu F, Wang H, Gao M, et al. Connection of difficult-to-form sheets by clinching process: a review. Mater Sci Technol 2022; 38: 622–644. DOI: 10.1080/02670836.2022.2062813.
10. Wu T, Liu K and Tovar A. Multiphase topology optimization of lattice injection molds. Comput Struct 2017; 192: 71–82. DOI: 10.1016/j.compstruc.2017.07.007.
11. Yallew TB, Kassegn E, Aregawi S, et al. Study on effect of process parameters on tensile properties of compression molded natural fiber reinforced polymer composites. SN Appl Sci 2020; 2: 1–8. DOI: 10.1007/s42452-020-2101-0.
12. Tamburrino F, D’Anto V, Bucci R, et al. Mechanical properties` of thermoplastic polymers for aligner manufacturing: in vitro study. Dent J 2020; 8: 47. DOI: 10.3390/dj8020047.
13. Mhetre GN, Jadhav VS, Deshmukh SP, et al. A review on additive manufacturing technology. ECS Trans 2022; 107: 15355–15374. DOI: 10.1149/10701.15355ecst.
14. Alzyod H and Ficzere P. Material-dependent effect of common printing parameters on residual stress and warpage deformation in 3D printing: a comprehensive finite element analysis study. Polymers 2023; 15: 2893. DOI: 10.3390/polym15132893.
15. Szczepanik S and Bednarczyk P. Bending and compression properties of abs and pet structural materials printed using FDM technology. J Cast Mater Eng 2017; 1: 39. DOI: 10. 7494/jcme.2017.1.2.39.
16. Reddy AH, Davuluri S and Boyina D. 3D printed lattice structures: a brief review. In: 2020 IEEE 10th International conference nanomaterials: applications & properties (NAP), Sumy, Ukraine, 9–13 November 2020. DOI: 10.1109/ NAP51477.2020.9309680.
17. Brennan-Craddock J, Brackett D, Wildman R, et al. The design of impact absorbing structures for additive manufacture. J Phys: Conf Ser 2012; 382: 012042. DOI: 10.1088/ 1742-6596/382/1/012042.
18. Mueller J and Shea K. Buckling, build orientation, and scaling effects in 3D printed lattices. Mater Today Commun 2018; 17: 69–75. DOI: 10.1016/j.mtcomm.2018.08.013.
19. Pan C, Han Y and Lu J. Design and optimization of lattice structures: a review. Appl Sci 2020; 10: 6374. DOI: 10.3390/ app10186374.
20. Gullapalli H, Masood SH, Riza S, et al. Flexural behaviour of 2D cellular lattice structures manufactured by fused deposition modelling. In: Advances in structures, systems and materials: select proceedings of ERCAM 2019. Singapore: Springer, 2020, pp. 109–117. DOI: 10.1007/978-981-15-3254-2_11.
21. Owaidat M. Resistance calculation of the face-centered cubic lattice: theory and experiment. Am J Phys 2013; 81: 918–922. DOI: 10.1119/1.4826256.
- Blattmann C, Helou M and Kara S. Characterisation of reinforced body centered cubic, octahedral-type and octet truss lattice structures. Procedia CIRP 2019; 84: 38–42. DOI: 10. 1016/j.procir.2019.04.299.
- Li B and Shen C. Solid stress-distribution-oriented design and topology optimization of 3d-printed heterogeneous lattice structures with light weight and high specific rigidity. Polymers 2022; 14: 2807. DOI: 10.3390/polym14142807.
- Ursini C and Collini L. Fdm layering deposition effects on mechanical response of tpu lattice structures. Materials 2021; 14: 5645. DOI: 10.3390/ma14195645.
- Monkova K, Monka PP, Tkac J, et al. A bending test of the additively produced porous sample. In: Proceedings of 5th international conference on the industry 40 model for advanced manufacturing: AMP 2020, Belgrade, Serbia, 1–4 June 2020, pp. 59–68. DOI: 10.1007/978-3-030-46212-3_3.
- Beloshenko V, Beygelzimer Y, Chishko V, et al. Mechanical properties of thermoplastic polyurethane-based threedimensional-printed lattice structures: role of build orientation, loading direction, and filler. 3D Print Addit Manuf 2023; 10: 245–255. DOI: 10.1089/3dp.2021.0031.
- Tiwari P, Naskar S and Mukhopadhyay T. Programmed outof-plane curvature to enhance multimodal stiffness of bending-dominated composite lattices. AIAA J 2023; 61: 1820–1838. DOI: 10.2514/1.J062573.
- Khosravani MR, Zolfagharian A, Jennings M, et al. Structural performance of 3D-printed composites under various loads and environmental conditions. Polym Test 2020; 91: 106770. DOI: 10.1016/j.polymertesting.2020.106770.
- Liu H, Yang Z and Long L. Mechanical properties of stretchingbending synergistic lattice materials. J Phys: Conf Ser 2023; 2535: 012019. DOI: 10.1088/1742-6596/2535/1/012019.
- Liu Z, Chen H and Xing S. Mechanical performances of metalpolymer sandwich structures with 3D-printed lattice cores subjected to bending load. Archiv Civ Mech Eng 2020; 20: 89. DOI: 10.1007/s43452-020-00095-1.
- Zhou X, Li J, Qu C, et al. Bending behavior of hybrid sandwich composite structures containing 3D printed PLA lattice cores and magnesium alloy face sheets. J Adhes 2022; 98: 1713–1731. DOI: 10.1080/00218464.2021.1939015.
- Salazar B, Williams I, Aghdasi P, et al. Bending and crack characteristics of polymer lattice-reinforced mortar. In: International congress on polymers in concrete (ICPIC 2018) polymers for resilient and sustainable concrete infrastructure. Cham, Switzerland. Springer, 2018, pp. 261–266. DOI: 10. 1007/978-3-319-78175-4_32.
- Rueger Z, Li D and Lakes R. Observation of Cosserat elastic effects in a tetragonal negative Poisson’s ratio lattice. Physica Status Solidi (B) 2017; 254: 1600840. DOI: 10.1002/pssb.201600840.
- Huang J, Ren H, Zhang R, et al. Supramolecular self-assembly of perylene bisimide-based rigid giant tetrahedra. ACS Nano 2020; 14: 8266–8275. DOI: 10.1021/acsnano.0c01971.
- Park K-M, Min K-S and Roh Y-S. Design optimization of lattice structures under compression: study of unit cell types and cell arrangements. Materials 2021; 15: 97. DOI: 10.3390/ ma15010097.
- Umer R, Barsoum Z, Jishi H, et al. Analysis of the compression behaviour of different composite lattice designs.
J Compos Mater 2018; 52: 715–729. DOI: 10.1177/ 0021998317714531.
37. Dar UA, Mian HH, Abid M, et al. Quasi-static compression and deformation behavior of additively manufactured flexible polymeric lattice structure. J Mater Eng Perform 2022; 31: 3107–3119. DOI: 10.1007/s11665-021-06419-3.
38. Kohnen P, Haase C, Bültmann J, et al. Mechanical properties and deformation behavior of additively manufactured lattice structures of stainless steel. Mater Des 2018; 145: 205–217. DOI: 10.1016/j.matdes.2018.02.062.
39. Spear DG and Palazotto AN. Investigation and Statistical Modeling of the mechanical properties of additively manufactured lattices. Materials 2021; 14: 3962. DOI: 10.3390/ ma14143962.
40. Striemann P, Eichenhofer M, Schupp D, et al. Compression testing of additively manufactured continuous carbon fiberreinforced sandwich structures. Mater Test 2018; 60: 801–808. DOI: 10.3139/120.111216.
41. Li C, Lei H, Liu Y, et al. Crushing behavior of multi-layer metal lattice panel fabricated by selective laser melting. Int J Mech Sci 2018; 145: 389–399. DOI: 10.1016/j.ijmecsci.2018. 07.029.
42. Wu Y, Fang J, Wu C, et al. Additively manufactured materials and structures: a state-of-the-art review on their mechanical characteristics and energy absorption. Int J Mech Sci 2023; 246: 108102. DOI: 10.1016/j.ijmecsci.2023.108102.
43. Nasrullah AIH, Santosa SP and Dirgantara T. Design and optimization of crashworthy components based on lattice structure configuration. Structures 2020; 26: 969–981. DOI: 10.1016/j.istruc.2020.05.001.
44. Sun Z, Guo Y and Shim V. Characterisation and modeling of additively-manufactured polymeric hybrid lattice structures for energy absorption. Int J Mech Sci 2021; 191: 106101. DOI: 10.1016/j.ijmecsci.2020.106101.
45. Neuhauserová M, Fíla T, Koudelka P, et al. Compressive behaviour of additively manufactured periodical re-entrant tetrakaidecahedral lattices at low and high strain-rates. Metals 2021; 11: 1196. DOI: 10.3390/met11081196.
46. Amani Y, Dancette S, Delroisse P, et al. Compression behavior of lattice structures produced by selective laser melting: X-ray tomography based experimental and finite element approaches. Acta Mater 2018; 159: 395–407. DOI: 10.1016/j. actamat.2018.08.030.
47. Qi D, Yu H, Liu M, et al. Mechanical behaviors of SLM additive manufactured octet-truss and truncated-octahedron lattice structures with uniform and taper beams. Int J Mech Sci 2019; 163: 105091. DOI: 10.1016/j.ijmecsci.2019.105091.
48. Ling C, Cernicchi A, Gilchrist MD, et al. Mechanical behaviour of additively-manufactured polymeric octet-truss lattice structures under quasi-static and dynamic compressive loading. Mater Des 2019; 162: 106–118. DOI: 10.1016/j. matdes.2018.11.035.
49. Lian J and Wang Z. Impact response of Re-entrant hierarchical honeycomb. Materials 2023; 16: 7121. DOI: 10.3390/ ma16227121.
50. Jimbo K and Tateno T. Design of isotropic-tensile-strength lattice structure fabricated by AM. J Soc Mech Eng 2019; 85: 18-00098. DOI: 10.1299/TRANSJSME.18-00098.
-
Fadeel A, Abdulhadi H, Newaz G, et al. Computational investigation of the post-yielding behavior of 3D-printed polymer lattice structures. J Comput Des Eng 2022; 9: 263–277. DOI: 10.1093/jcde/qwac001.
-
Wang S, Wang J, Xu Y, et al. Compressive behavior and energy absorption of polymeric lattice structures made by additive manufacturing. Front Mech Eng 2020; 15: 319–327. DOI: 10.1007/s11465-019-0549-7.
-
Nuñez P, Rivas A, García-Plaza E, et al. Dimensional and surface texture characterization in fused deposition modelling (FDM) with ABS plus. Procedia Eng 2015; 132: 856–863. DOI: 10.1016/j.proeng.2015.12.570.
-
Wang J, Shi C, Yang N, et al. Strength, stiffness, and panel peeling strength of carbon fiber-reinforced composite sandwich structures with aluminum honeycomb cores for vehicle body. Compos Struct 2018; 184: 1189–1196. DOI: 10.1016/j. compstruct.2017.10.038.
-
Alzyod H and Ficzere P. Ironing process optimization for enhanced properties in material extrusion technology using Box–Behnken Design. Sci Rep 2024; 14: 2300. DOI: 10.1038/ s41598-024-52827-5.
-
Vidakis N, Petousis M, Vairis A, et al. A parametric determination of bending and Charpy’s impact strength of ABS and ABS-plus fused deposition modeling specimens. Prog Addit Manuf 2019; 4: 323–330. DOI: 10.1007/s40964-019- 00092-8.
-
Ahn SH, Montero M, Odell D, et al. Anisotropic material properties of fused deposition modeling ABS. Rapid Prototyp J 2002; 8: 248–257. DOI: 10.1108/13552540210441166.
-
Alzyod H, Borbas L and Ficzere P. Rapid prediction and optimization of the impact of printing parameters on the residual stress of FDM-ABS parts using L27 orthogonal array design and FEA. Mater Today Proc 2023; 93: 583–588. DOI: 10.1016/j.matpr.2023.02.213.